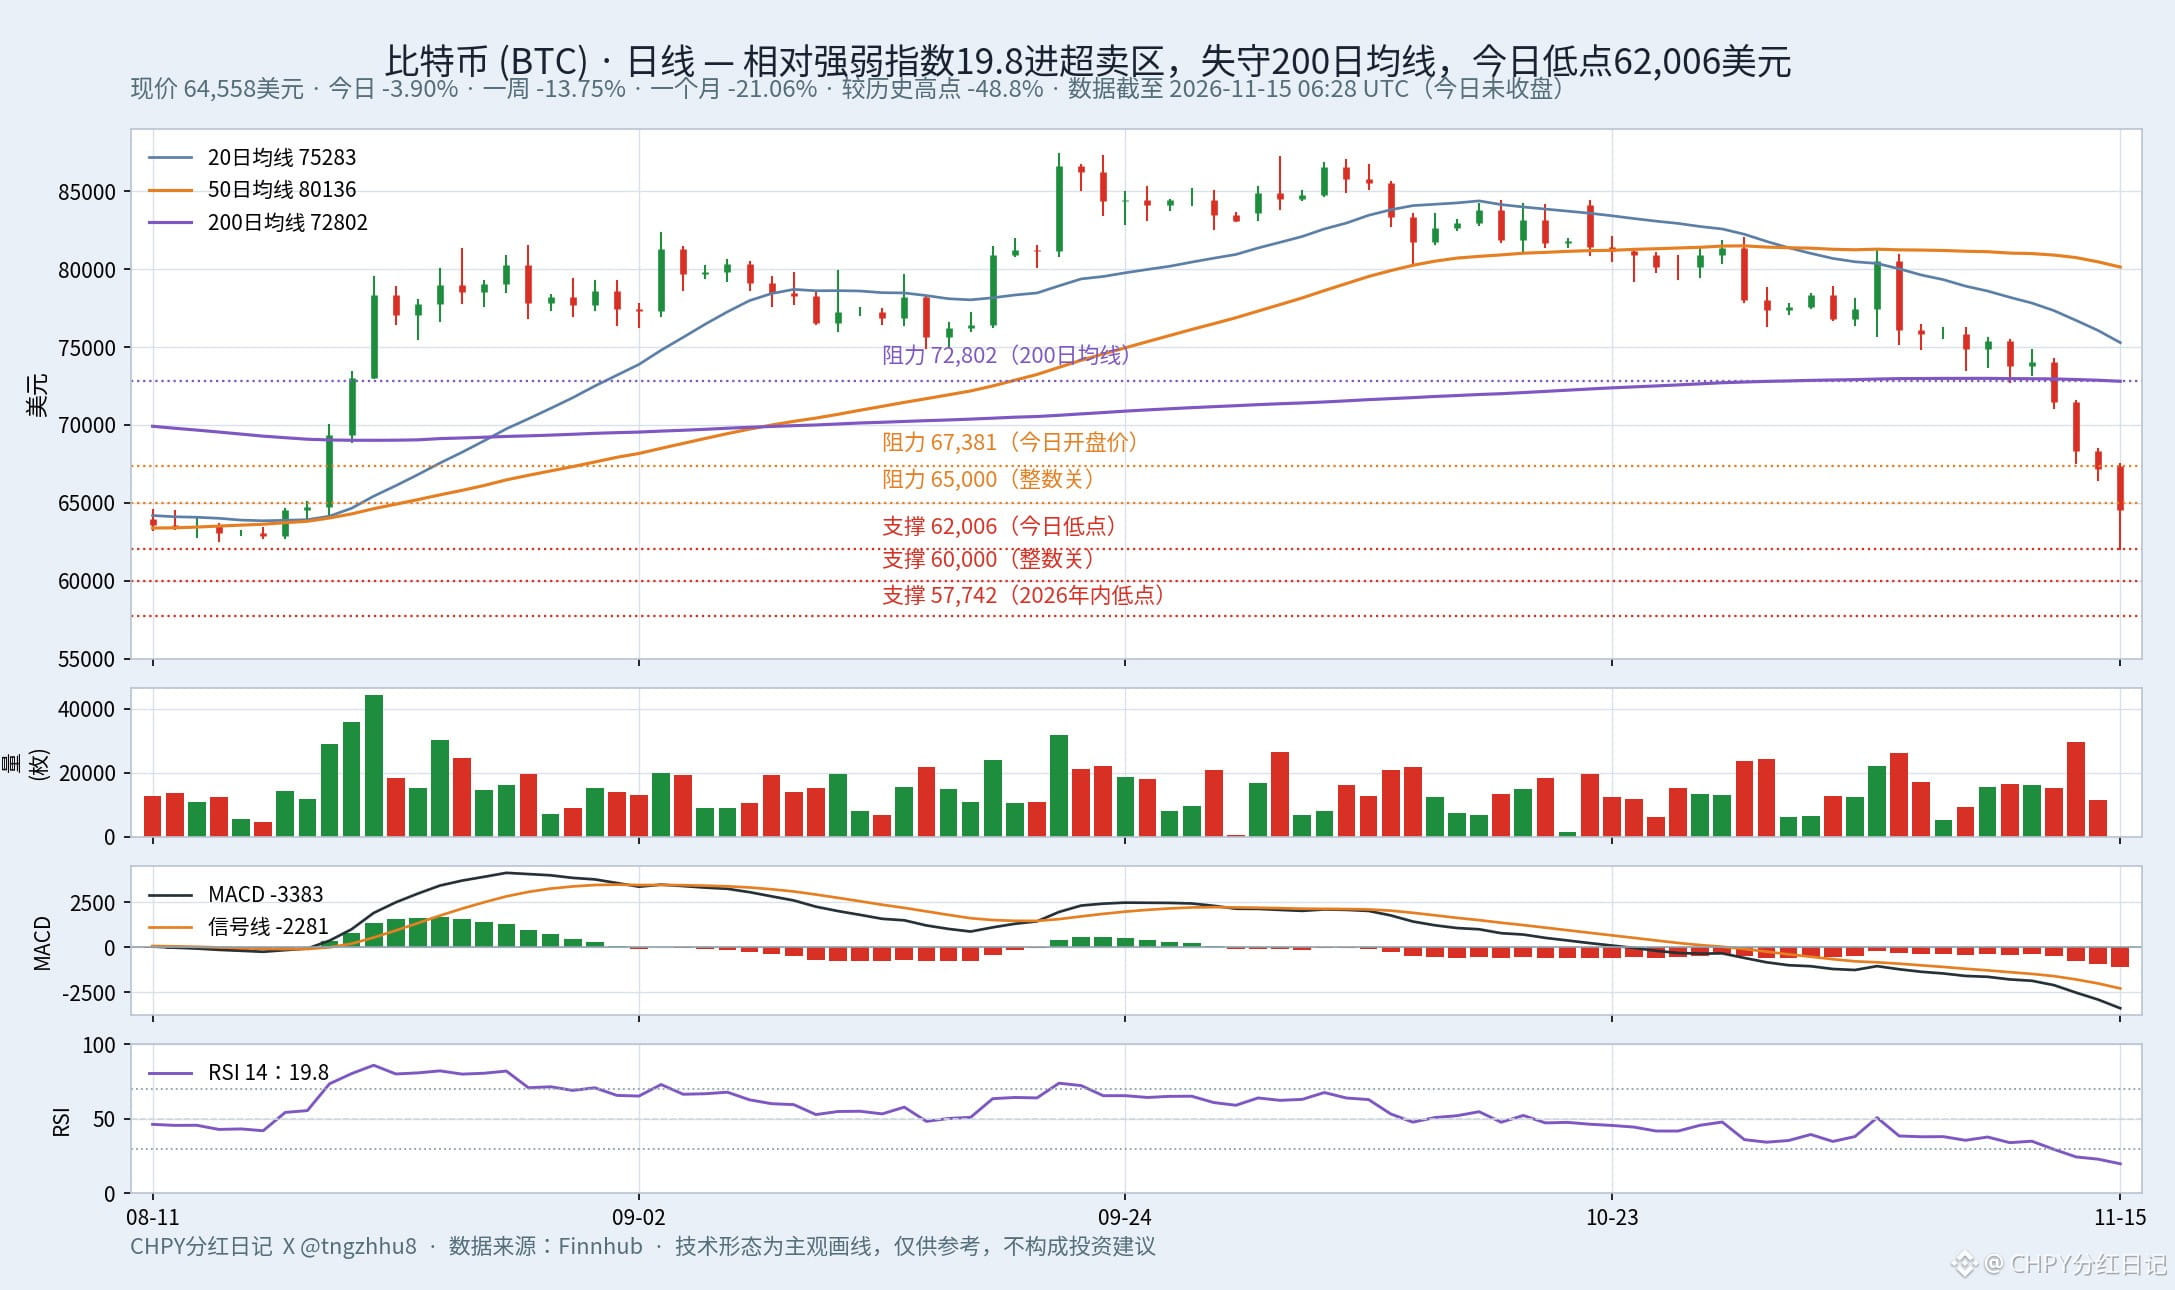
Bitcoin plunged to $62,006 in the early hours today, its lowest level since July 13. That’s just $181 above the July 13 low of $61,825, and only 3.3% away from the psychological $60,000 mark. It then rebounded to $64,558, up 4.1% from the low, with an intraday range of 8.9%. At one point in the early hours, it climbed back above $65,000, triggering the liquidation of $121 million in short positions in one hour. Short covering added fuel to the rally: when short sellers are forced to buy back their positions to close them, that buying can push prices higher. But the rally failed to break through $65,000, and the price slipped back down.
Technically, conditions have reached an extreme. The 14-day Relative Strength Index is just 19.8. A reading below 30 indicates oversold conditions; a drop below 20 is a first in nearly 90 days, suggesting selling has gone too far in the short term. The price has closed below the 200-day moving average for three consecutive days. Technical traders often call the 200-day moving average the dividing line between bull and bear markets. It currently stands at $72,802, 11.3% above the price. The 20-day and 50-day moving averages, at $75,283 and $80,136 respectively, are both overhead. The price is below all three averages, and the shorter-term averages are turning down. The MACD histogram is at -1,102, down further from -897 the previous day. MACD is a momentum indicator that tracks the difference between faster and slower moving averages. As the histogram grows further below the zero line, it signals that downward momentum is still strengthening. MACD has now remained below zero for 41 consecutive days.
Trading volume tells a similar story. The large bearish candle on November 13 saw 29,649 coins traded, 2.1 times the 30-day average, as panic selling drove a concentrated exit. Volume fell over the weekend: fewer people were selling, but buyers had yet to return.
Watch these three levels: to the upside, $65,000 needs to hold before a rebound toward today’s opening price of $67,381 and the November 13 closing price of $68,314 can be considered. To the downside, watch today’s low of $62,006. A break below that would put the psychological $60,000 mark in focus, followed by the 2026 low of $57,742. The probability of a 25-basis-point rate hike in December is around 88%, and spot Bitcoin exchange-traded funds have seen $2.35 billion in outflows over two weeks. Both macro conditions and fund flows are favoring the bears.
Oversold conditions can lead to a rebound, but they don’t mean the bottom is in. Without a pickup in volume, treat any bounce as a dead-cat bounce—a brief recovery after a steep drop, followed by another decline. For a genuine reversal, wait for a high-volume bullish candle to close back above $65,000, or for selling to ease on heavy volume near $60,000.
#比特币 #TechnicalAnalysis
$BTC $ETH $SOL
Technically, conditions have reached an extreme. The 14-day Relative Strength Index is just 19.8. A reading below 30 indicates oversold conditions; a drop below 20 is a first in nearly 90 days, suggesting selling has gone too far in the short term. The price has closed below the 200-day moving average for three consecutive days. Technical traders often call the 200-day moving average the dividing line between bull and bear markets. It currently stands at $72,802, 11.3% above the price. The 20-day and 50-day moving averages, at $75,283 and $80,136 respectively, are both overhead. The price is below all three averages, and the shorter-term averages are turning down. The MACD histogram is at -1,102, down further from -897 the previous day. MACD is a momentum indicator that tracks the difference between faster and slower moving averages. As the histogram grows further below the zero line, it signals that downward momentum is still strengthening. MACD has now remained below zero for 41 consecutive days.
Trading volume tells a similar story. The large bearish candle on November 13 saw 29,649 coins traded, 2.1 times the 30-day average, as panic selling drove a concentrated exit. Volume fell over the weekend: fewer people were selling, but buyers had yet to return.
Watch these three levels: to the upside, $65,000 needs to hold before a rebound toward today’s opening price of $67,381 and the November 13 closing price of $68,314 can be considered. To the downside, watch today’s low of $62,006. A break below that would put the psychological $60,000 mark in focus, followed by the 2026 low of $57,742. The probability of a 25-basis-point rate hike in December is around 88%, and spot Bitcoin exchange-traded funds have seen $2.35 billion in outflows over two weeks. Both macro conditions and fund flows are favoring the bears.
Oversold conditions can lead to a rebound, but they don’t mean the bottom is in. Without a pickup in volume, treat any bounce as a dead-cat bounce—a brief recovery after a steep drop, followed by another decline. For a genuine reversal, wait for a high-volume bullish candle to close back above $65,000, or for selling to ease on heavy volume near $60,000.
#比特币 #TechnicalAnalysis
$BTC $ETH $SOL