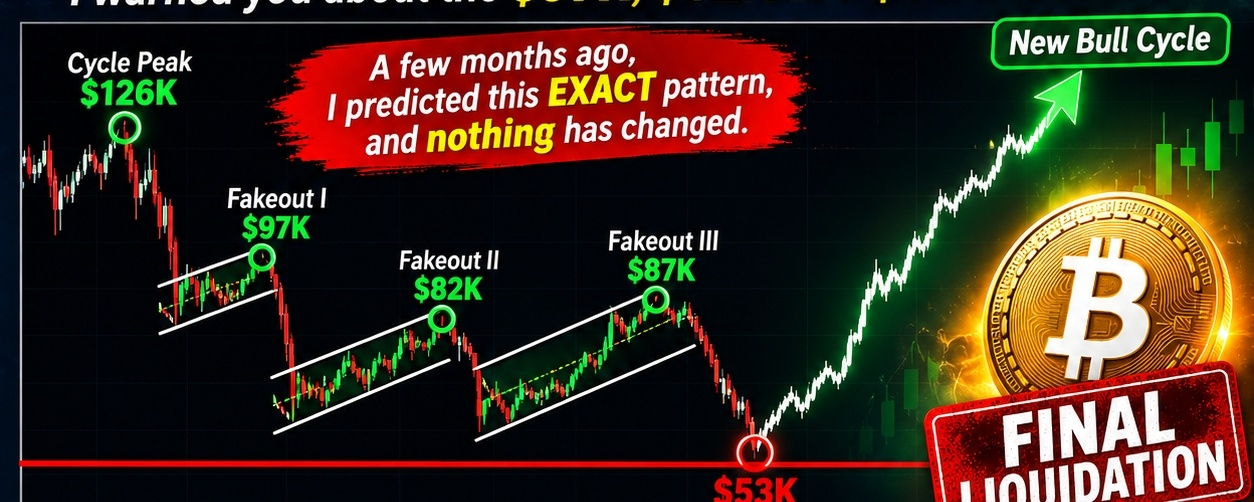

Bitcoin investors may need to prepare for another difficult phase.
Looking at the historical price structure in the chart, an interesting pattern appears. Previous recovery attempts around $97K, $82K, and $87K were followed by significant selling pressure.
Could the market be repeating a similar cycle?
Here is the potential downside roadmap I'm watching:
📉 $66K – First important downside level
📉 $62K – Next potential support
📉 $57K – A deeper correction zone
📉 $53K – Major potential bottom area
However, the bigger picture is what makes this scenario interesting.
A deeper correction does not automatically mean the end of Bitcoin's long-term bull market. Sometimes, market resets create the conditions for a stronger recovery.
My personal view:
I am watching the $53K region as a possible cycle-bottom area. If Bitcoin reaches this zone and shows strong buying pressure, the nextmajor bullish phase could become an interesting opportunity.
But remember: This is a market scenario, not a guaranteed prediction. A strong recovery above key resistance levels could invalidate the bearish roadmap.
🎯 The real question: Is Bitcoin preparing for another shakeout before its next major move?
What do you think?
Will $BTC visit $53K first, or will the bulls take control earlier?$ZEC $ETH
Share your analysis below. Let's discuss!
#bitcoin #BTC走势分析 #CryptoMarket #BitcoinAnalysis #CryptoTrends2024 rading