🔥 Bloomberg: $BTC led risk assets higher—and may now be signaling deflation
Bloomberg Intelligence senior commodity strategist Mike McGlone warns that Bitcoin led the rally in risk assets and may now be leading the way down—signaling a period of deflation.
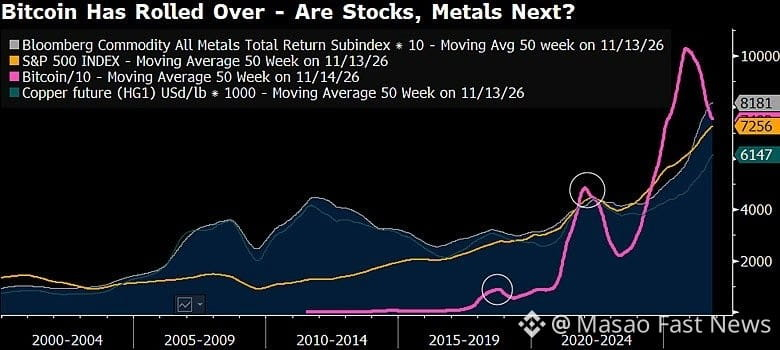
McGlone’s argument is based on the 50-week moving average chart: $BTC is “rolling” down from a prolonged sideways range, similar to the pattern seen in the 2018 and 2022 bear markets—while stocks, metals, and copper have yet to follow. He believes that if $BTC fails to show strength, “the dominoes could fall”—and has previously warned that $BTC could return to the $10,000 range if U.S. stocks undergo a 20% correction.
$BTC is currently trading around $64,918, down 3.57% over 24 hours, with a daily low of $62,006—it has recovered slightly from last night’s low but remains below the $66,000 mark.
📌 Knowledge corner: The 50-week moving average is a long-term trend indicator. When the price breaks below this line after an extended period of moving sideways, many technical analysts interpret it as a trend reversal signal, not just a short-term correction.
Do you think $BTC is just “spooking” the market—or is this truly a warning signal for both stocks and metals?
Bloomberg Intelligence senior commodity strategist Mike McGlone warns that Bitcoin led the rally in risk assets and may now be leading the way down—signaling a period of deflation.
McGlone’s argument is based on the 50-week moving average chart: $BTC is “rolling” down from a prolonged sideways range, similar to the pattern seen in the 2018 and 2022 bear markets—while stocks, metals, and copper have yet to follow. He believes that if $BTC fails to show strength, “the dominoes could fall”—and has previously warned that $BTC could return to the $10,000 range if U.S. stocks undergo a 20% correction.
$BTC is currently trading around $64,918, down 3.57% over 24 hours, with a daily low of $62,006—it has recovered slightly from last night’s low but remains below the $66,000 mark.
📌 Knowledge corner: The 50-week moving average is a long-term trend indicator. When the price breaks below this line after an extended period of moving sideways, many technical analysts interpret it as a trend reversal signal, not just a short-term correction.
Do you think $BTC is just “spooking” the market—or is this truly a warning signal for both stocks and metals?