🔴 $BNB /USDT · Bias: SHORT
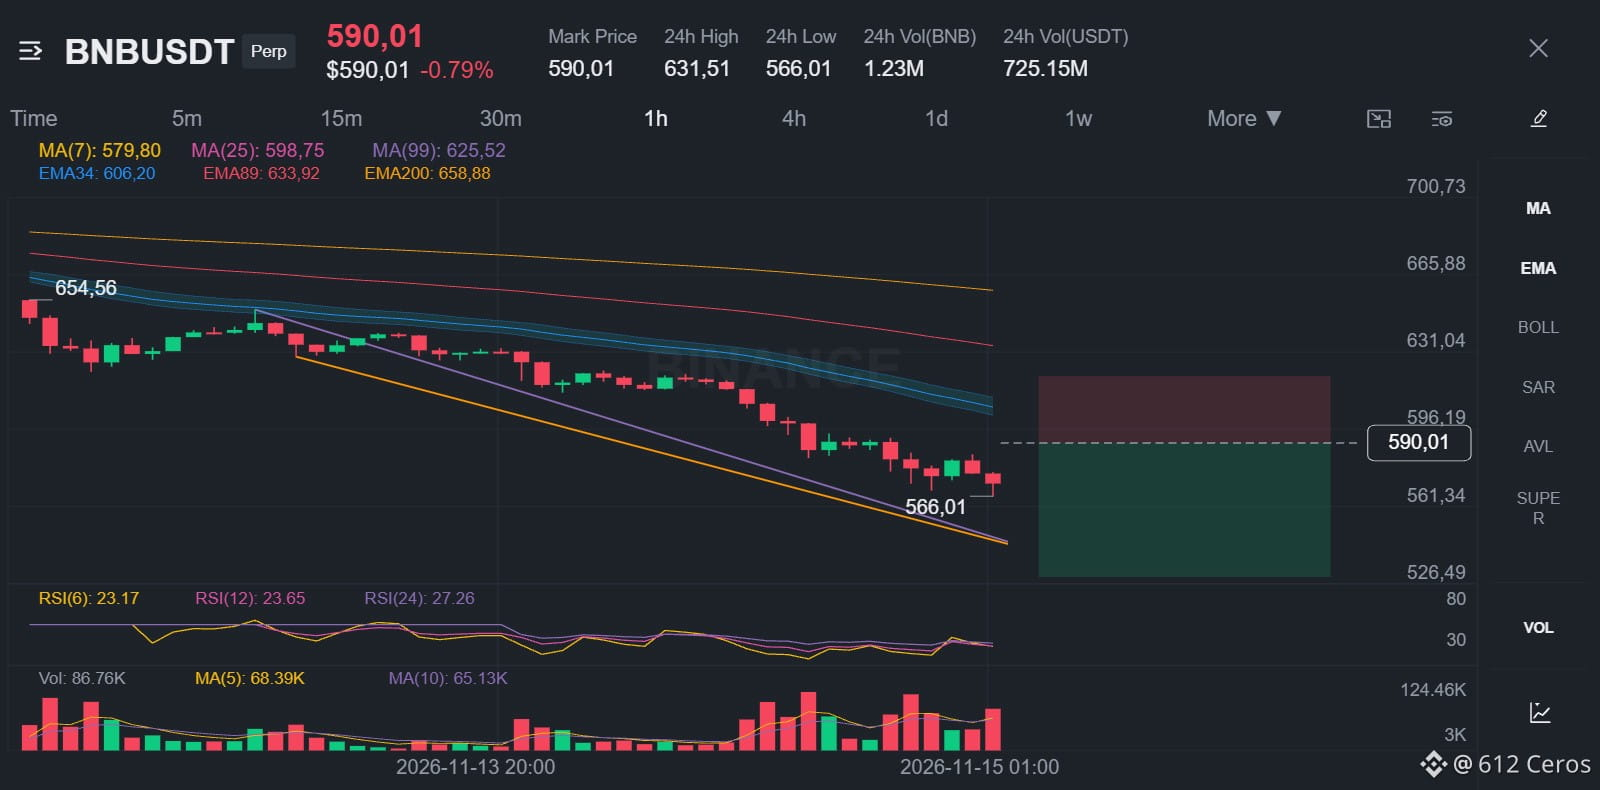
BNB price sits below bearish EMA stacks on the 4h and 1h charts, so the trend should keep pushing down.
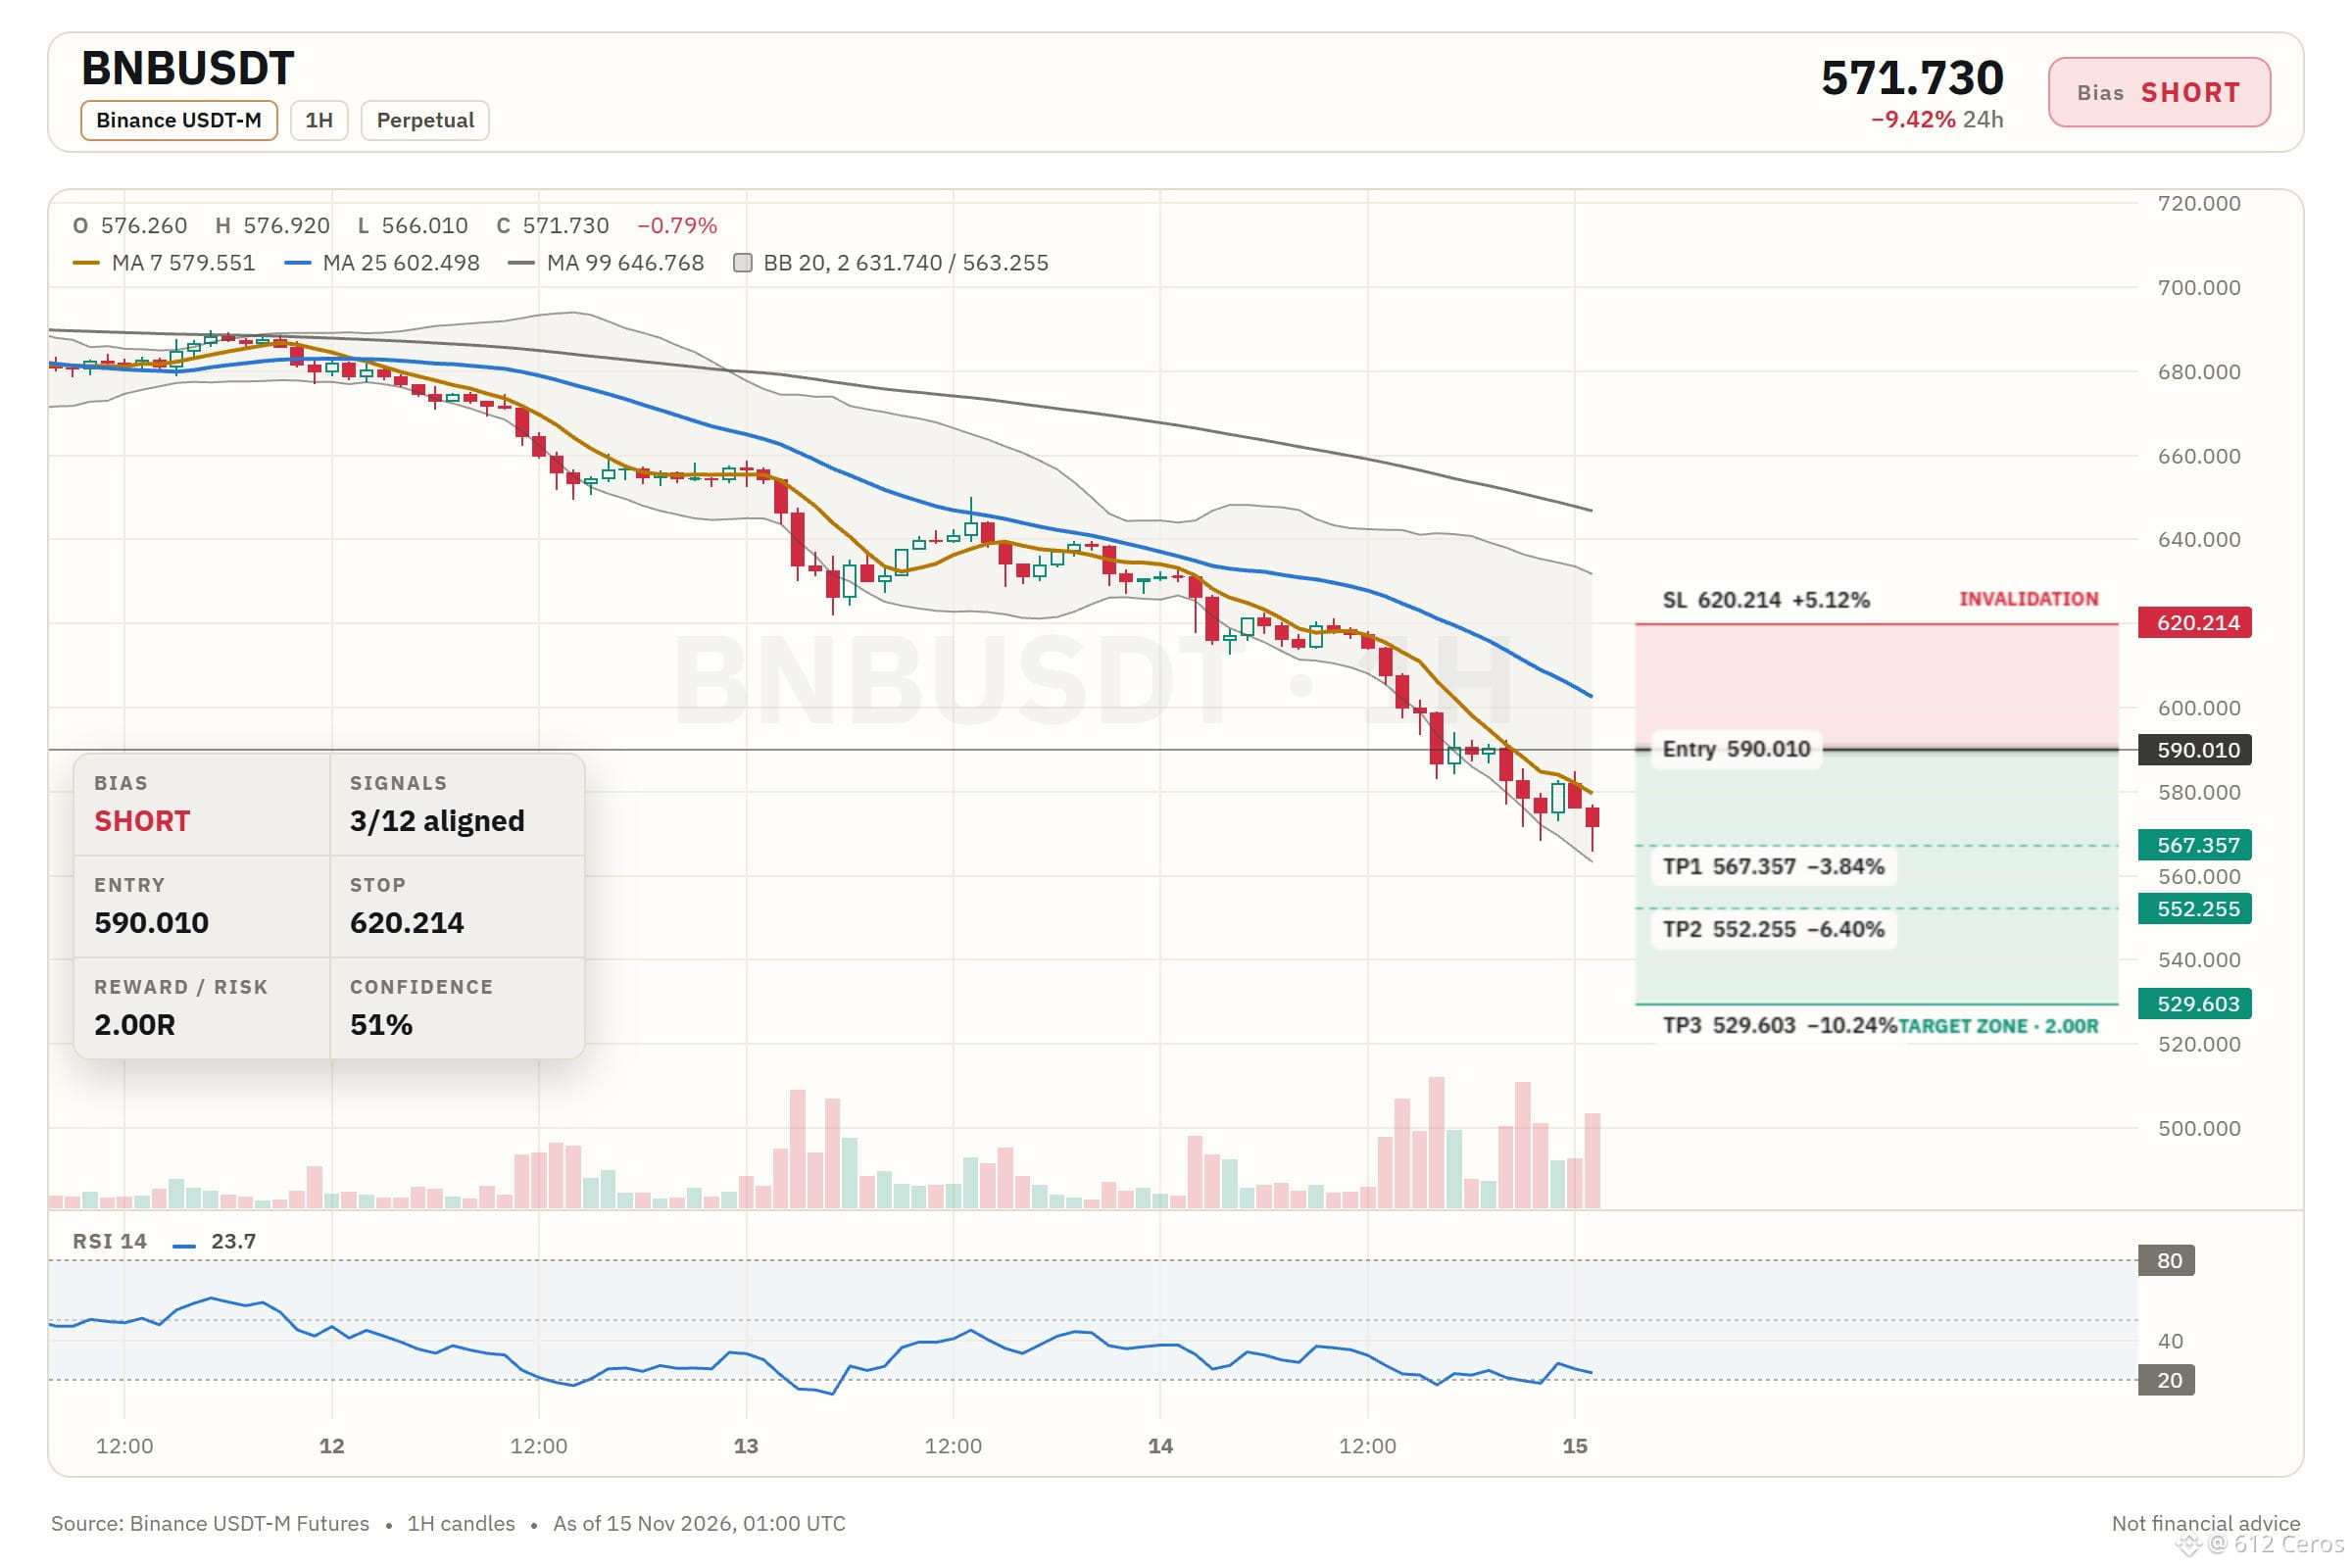
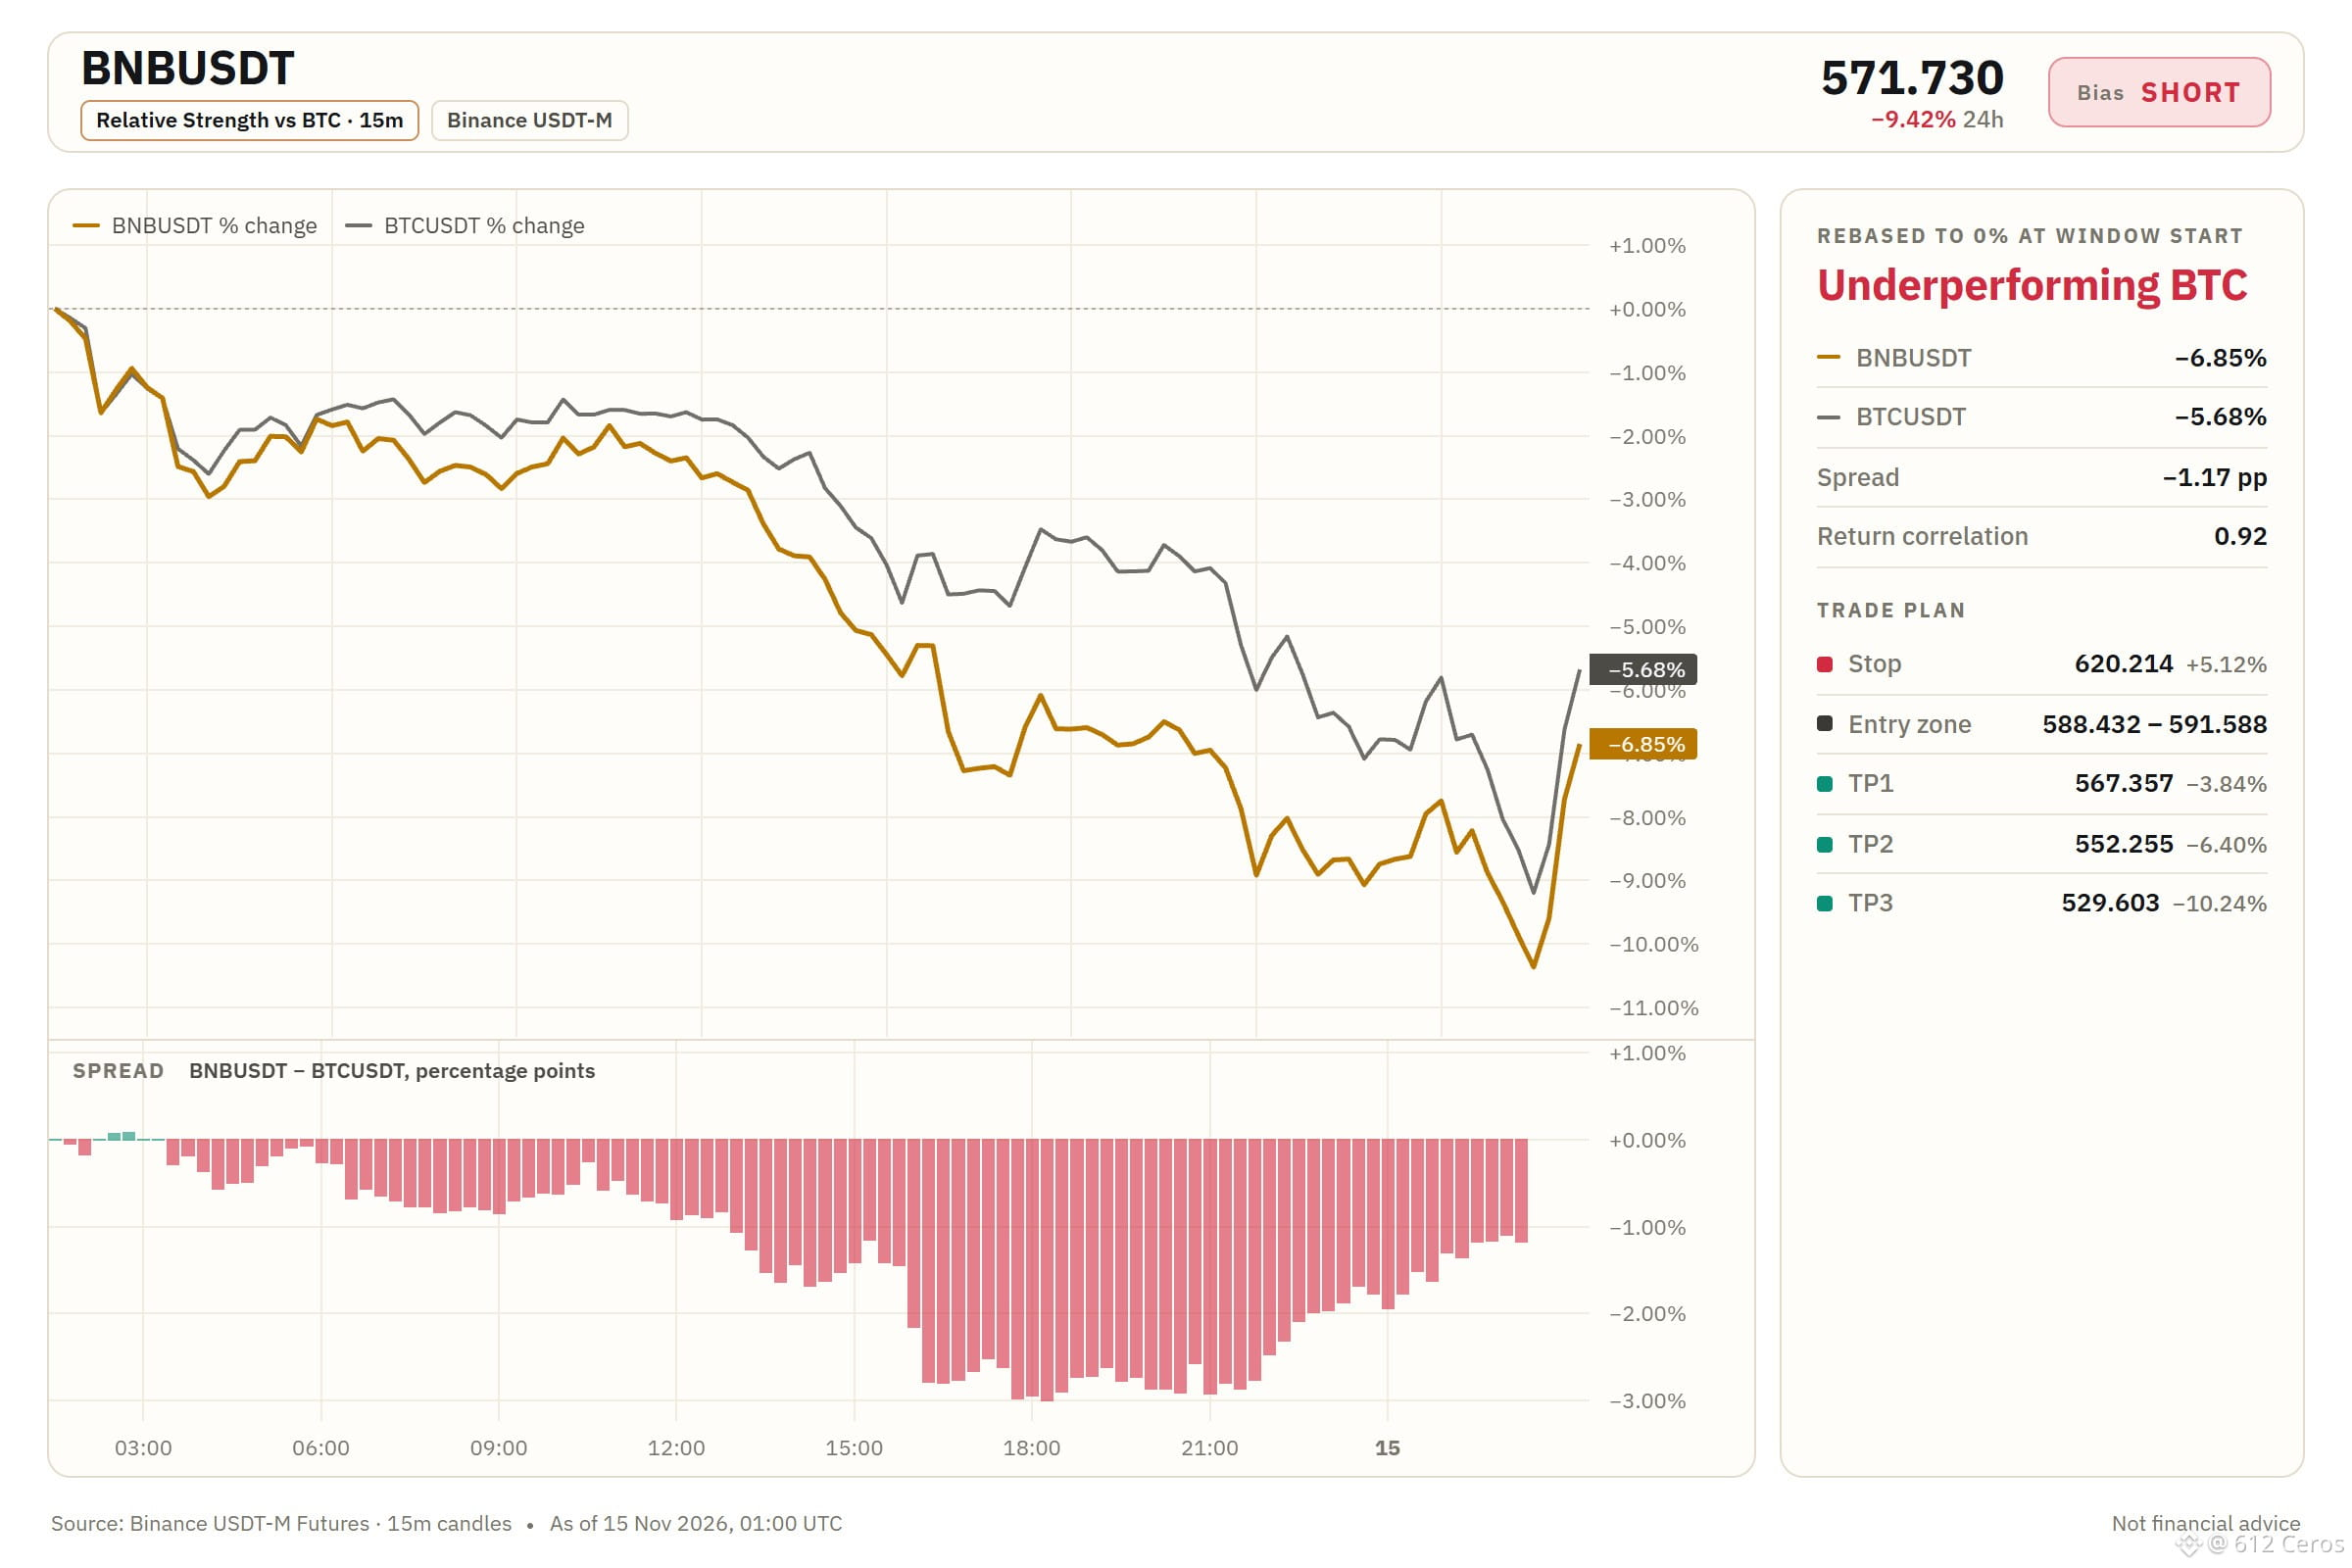
Entry: 588.432 – 591.588
TP1: 567.357 (-3.8%)
TP2: 552.255 (-6.4%)
TP3: 529.603 (-10.2%)
SL: 620.214 (+5.1%)
Note: moderate conviction only, keep size light.
Why: The 4h trend shows price below EMA50 and EMA200 with a bearish stack, meaning the swing trend is down.
Risk: Price is washed out, bounces are common from here (4h RSI 16.6, oversold)
Plan: close 50% at TP1, 25% at TP2, 25% at TP3, and move the stop to entry after TP1.
Do you agree this setup is worth a short here?
⚠️ Personal market analysis only. NFA — manage risk and DYOR.
Educational content, not investment advice or a recommendation to buy, sell, deposit, or withdraw any asset. No paid promotion or referral/affiliate links.
BNB price sits below bearish EMA stacks on the 4h and 1h charts, so the trend should keep pushing down.
Entry: 588.432 – 591.588
TP1: 567.357 (-3.8%)
TP2: 552.255 (-6.4%)
TP3: 529.603 (-10.2%)
SL: 620.214 (+5.1%)
Note: moderate conviction only, keep size light.
Why: The 4h trend shows price below EMA50 and EMA200 with a bearish stack, meaning the swing trend is down.
Risk: Price is washed out, bounces are common from here (4h RSI 16.6, oversold)
Plan: close 50% at TP1, 25% at TP2, 25% at TP3, and move the stop to entry after TP1.
Do you agree this setup is worth a short here?
⚠️ Personal market analysis only. NFA — manage risk and DYOR.
Educational content, not investment advice or a recommendation to buy, sell, deposit, or withdraw any asset. No paid promotion or referral/affiliate links.