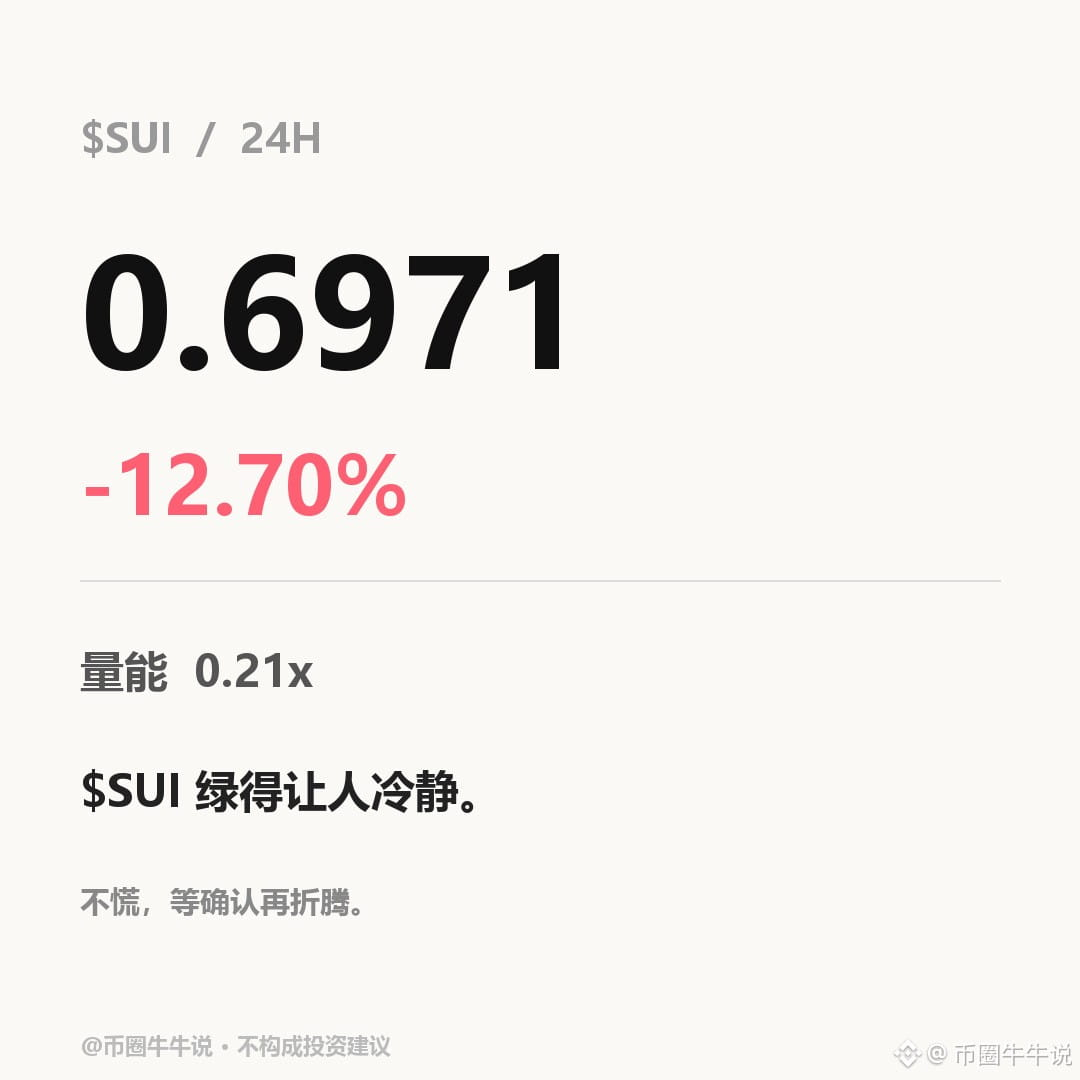
$SUI is currently at 0.6971, down 12.70% over the past 24 hours. However, the 1-hour RSI has fallen to 20.44, and the 4-hour RSI is also stuck at 22.16. Both timeframes are oversold at the same time, which looks very much like a potential precursor to a bear trap. The support level at 0.6755 is just below; if the price stabilizes there, it could trigger a technical rebound. However, both the 1-hour and 4-hour trends remain weak, indicating that the price structure has not yet bottomed.
The conflict between oversold RSI readings and a weak trend essentially reflects a tug-of-war between fading bearish momentum and insufficient buying strength. If the price breaks below 0.6755, the oversold signal will be invalidated; if it holds above that level with a simultaneous increase in trading volume, a double-bottom pattern could form.
**Question**: Does an oversold RSI mean that SUIUSDT is about to bottom out?
A genuine bottom requires the price to hold above support, accompanied by an increase in trading volume—not just an indicator signal. This is not investment advice.
Related asset: $SUI
#SUI
The conflict between oversold RSI readings and a weak trend essentially reflects a tug-of-war between fading bearish momentum and insufficient buying strength. If the price breaks below 0.6755, the oversold signal will be invalidated; if it holds above that level with a simultaneous increase in trading volume, a double-bottom pattern could form.
**Question**: Does an oversold RSI mean that SUIUSDT is about to bottom out?
A genuine bottom requires the price to hold above support, accompanied by an increase in trading volume—not just an indicator signal. This is not investment advice.
Related asset: $SUI
#SUI