
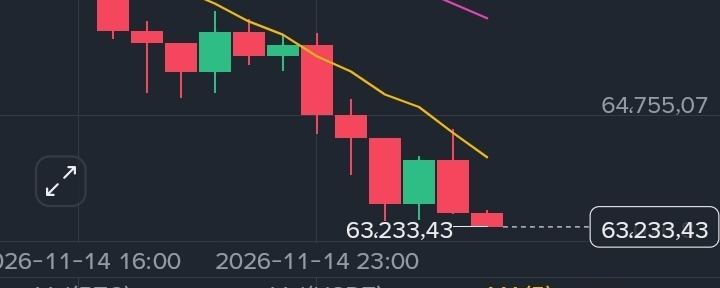

The market is looking bleak tonight. Bitcoin is breaking through one support level after another, currently trading in the $63,300–$64,900 range after a sharp drop of more than 6% in 24 hours, reaching its lowest level since mid-August. Price discrepancies across platforms ($63,943 on Bitget, $64,921 on Gate, and $63,759 according to CoinMarketCap) reflect turbulent liquidity and extreme volatility.
The numbers speak for themselves: billions in liquidations and extreme fear
Over the past 24 hours, liquidations across the entire market exceeded $1.9 billion, the vast majority from long positions. Data indicates that 87% of Bitcoin liquidations were long positions, meaning those who tried to catch the bottom too early took a painful hit.
The Fear & Greed Index is the clearest reflection of this situation: it registered 10, a level of "Extreme Fear," down from 13 yesterday. This sharp drop in the index reflects a sense of "psychological capitulation" currently gripping traders.
Why all this decline? Three key factors
1. Interest rate hike expectations: CME FedWatch data indicates that the market assigns an 88.5% probability to the Federal Reserve raising interest rates by 25 basis points this December, with an 11.5% chance of a 50-basis-point hike. This tightening pressure is pushing investors away from high-risk assets.
2. ETF outflows: From October 30 to November 13, U.S. spot Bitcoin funds recorded net outflows approaching $3 billion. On November 13 alone, $185.4 million flowed out, including $143.5 million from BlackRock and $41.9 million from Fidelity.
3. A string of negative factors: Declines in technology and AI stocks, along with the ongoing fallout from the $6 billion Binance hack, are all weighing on sentiment.
The technical battle: The 200-week average and a support breakdown
Bitcoin has broken below its 200-week moving average (around $65,700), a trend line many consider the "historical bear-market boundary." Attention is now focused on the $63,000 area as the first psychological and technical support level. If it breaks, Glassnode data warns that the next dense liquidation zone lies between $59,500 and $62,600, an area that has not been tested since the August low.
On the other hand, some analysts see signs that the "peak of forced liquidations may be behind us." Liquidation volumes in recent hours have slowed from an "avalanche" to a "slow bleed" ($5.25 million over 4 hours, and $2.63 million in just one hour). Bitcoin's open interest-to-market-cap ratio is also at 3.40%, a relatively low level, meaning leverage has become "thin" and positions are no longer heavily crowded.
What does this mean for the average trader?
· Don't catch a falling knife: With the Fear Index at 10, it's still too early to talk about a true bottom. The dual capitulation signal (psychological + capital) has not yet been completed.
· Watch $63,000: Any clear daily close below this level could open the way to the $60,000 area.
· Leverage is the biggest enemy: $1.9 billion in liquidations means many didn't get the direction wrong; they simply didn't survive long enough for it to play out.
My take:
Bitcoin is now in a zone where "heroics are not advisable." The market is going through a leverage flush, and macro factors (interest rates, inflation, ETF flows) are still weighing on it. The best approach is to watch and be patient. If prices stabilize above $63,000 and we start seeing green daily closes, this could be an opportunity. Until then, caution is the order of the day.
What do you think? Do you believe $63,000 will hold, or will we see $60,000 before any real rebound?
