
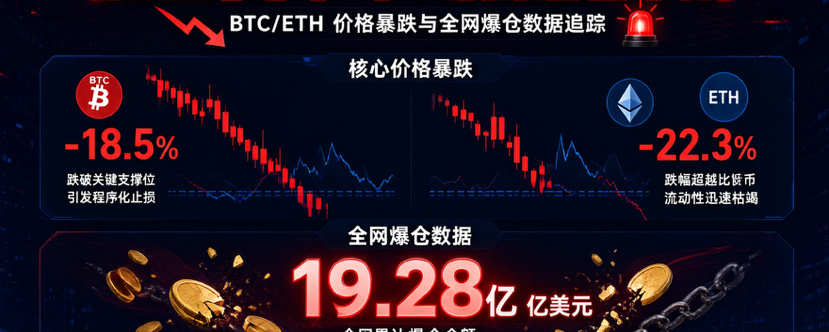

The numbers over the past 24 hours are stark: approximately $1.928 billion in liquidations across the crypto market, including $1.804 billion in long positions, or 93.6% of the total. More than 315,000 traders were forcibly liquidated. Bitcoin alone saw $684 million wiped out, while Ethereum lost around $467 million. Prices looked just as grim: Bitcoin fell 5.7% during Saturday’s US trading session, then continued sliding in Sunday’s Asian session to $63,311, its lowest level since August 17. Ethereum fell to $1,731, its lowest since July 9. The Fear and Greed Index dropped to 13, its lowest reading since early July.
Let’s make one thing clear: 93.6% of liquidations being long positions is not a signal that the market has bottomed—it’s the deleveraging process itself. The end of liquidations doesn’t mean the trend has reversed; it only means that money betting in the wrong direction has been forced out. What’s really worth watching is whether prices can stabilize in key support zones and whether capital flows show signs of a structural return.
I. The structure of this liquidation event says more than the numbers
Break down the $1.928 billion, and three details stand out.
First, over 90% of liquidated positions were longs, which shows this was not an aggressive short attack but longs stampeding over one another. The price breaks below a key level and triggers forced liquidations; those liquidation orders become market sell orders, pushing the price lower and triggering another round of liquidations—a chain reaction of “longs liquidating longs.” In these circumstances, the size of the drop depends not on how severe the bad news is, but on how much leverage has piled up.
Second, liquidations in BTC and ETH, the two major cryptocurrencies, totaled more than $1.1 billion, nearly 60% of the total market-wide figure. This shows that the liquidation event was not isolated to a particular altcoin, but a systemic purge of the overall long-position structure. If major coins are hit this hard, mid- and lower-cap assets with poorer liquidity will fall even more steeply. Altcoins broadly fell more than twice as much as Bitcoin in this sell-off; at its core, this reflects indiscriminate retreat by some investors.
Third, the timing was over the weekend. Market makers and institutional trading desks have thinner staffing over weekends, and order books are thinner, so the same selling pressure causes greater slippage. Friday and Saturday sell-offs are often “messier” than those on weekdays, with more wicks, gaps, and sudden deviations. That is also why extreme weekend lows usually need to be retested after the market opens the following week before they can be considered meaningful.

II. The 200-week moving average is lost: technicals enter “uncharted territory”
The most significant technical event in this decline is the breach of a long-term lifeline. The 200-week moving average is around $67,900–$68,000. Last week, the weekly candle closed decisively below this line for the first time (at about $67,234), and by this weekend the price had fallen further, to around $63,000. This moving average has held through most major corrections in past cycles. Once it is decisively breached, the technical significance of “long-term support” must be reassessed.
Short-term indicators have entered extreme territory: the daily RSI is around 22.96, indicating deeply oversold conditions. But to be clear, oversold only means the price fell quickly; it does not mean the decline is over. In a liquidity-constrained environment, the RSI can remain stuck in oversold territory for a long time.
There are three levels below worth noting: around $62,300 is the low-price area buyers defended twice this year; below that is $58,000–$59,000; and the year-to-date low is $57,742, recorded on July 1. Glassnode's distribution of supply shows a large concentration of coins in the $62,000–$66,000 range, meaning that a rebound into this area could encounter selling pressure from holders looking to break even. The levels above are clear: $70,000 has turned from support into resistance, while the 200-day moving average near $73,000 is the first hurdle to trend recovery.
III. The real pressure is coming from outside crypto
Looking only within crypto for the cause would lead to a misreading of this decline. Most of the forces weighing on prices are external.
Interest rates and the dollar. U.S. October CPI rose 0.4% month over month, while core CPI rose 0.3%; both were above expectations. The 10-year Treasury yield returned to around 5.15%, and the Dollar Index touched a two-year high of 103.4. Ahead of the December 8–9 rate decision, markets have nearly fully priced in a 25-basis-point hike, while the probability of a 50-basis-point hike has also risen to around 10%. Bitcoin generates no cash flow, so when risk-free rates rise above 5%, the opportunity cost of holding it is very real.
Institutional on-ramps are bleeding. U.S. spot Bitcoin ETFs saw nearly $3 billion in net outflows from October 30 to November 13. BlackRock's IBIT recorded net outflows for 11 consecutive trading days, with about $2.35 billion withdrawn in just two weeks. This is not retail panic; it is ongoing redemptions by allocation-focused investors.
The cash layer is shrinking. Glassnode data shows that the total stablecoin supply fell by about $14.2 billion over 30 days, its sharpest contraction since June 2022. Stablecoins are the crypto market's “on-market cash.” Their shrinking supply means fewer digital dollars are readily available to buy the dip—so when sell orders hit, bids are thinner.
The industry is also still absorbing the shock. The fallout from the approximately $6.34 billion Binance theft at the end of October continues. On November 14, Binance announced that withdrawals had been restored across 87 networks this week, with the goal of restoring all remaining networks and assets by the end of next week. On November 30, MSCI will remove Strategy from relevant indexes, prompting passive funds to adjust their holdings. None of these events triggered the day's crash, but they continue to lower the market's risk tolerance.
IV. Why blindly buying the dip is more dangerous than chasing shorts in a downtrend
The market is never short of dip-buying capital, and this downturn has proved that once again. Buying the dip is dangerous not because “the price hasn't fallen far enough,” but because three conditions are all missing:
The liquidity condition is not met. Stablecoin supply is shrinking, ETFs are seeing consecutive redemptions, and weekend order books are thin. The same buy order has to absorb more selling pressure, resulting in poor price performance. A “low price” order you place in a thin order book can easily be swept through by a single wick.
The leverage condition is not met. Some traders have pointed out that open interest remains high, and the market needs another round of deleveraging before a sustained reversal. As long as the liquidation cascade is not over, any rebound could simply provide liquidity for the next round of forced liquidations.
The structural condition is not met. The price has fallen below the average cost basis of short-term holders, leaving many recent buyers underwater. A rebound toward their cost basis will run into selling from holders trying to break even. This means the rebound has a dense “ceiling,” while the decline has an uncertain “floor.”
Chasing shorts is not easy either: the RSI is deeply oversold, funding rates have turned negative, and sentiment is extreme, so a sharp short-covering rally could happen at any time. But the risks are different. Chasing shorts risks losing money; buying the dip too early risks losing money, time, and peace of mind. The latter is more likely to lead people to keep adding to positions at the wrong prices, ultimately turning a manageable loss into an unmanageable one.

V. Trading strategy: the left side is about conditions; the right side is about confirmation
Overall assessment. This is a trend decline driven by the combined forces of “macro tightening + institutional redemptions + deleveraging,” not a sharp drop caused by a single piece of bad news. Until funding conditions change, treat rebounds as relief rallies, not reversals.
BTC trading framework. To speculate on a short-term rebound on the left side, act only if all three conditions are met: First, the price enters the historical support zone of $62,000–$63,000 and shows a clear bottoming pattern (a 4-hour candle with a long lower wick, followed by a move that does not break the previous low). Second, futures open interest and funding rates show signs of recovery together (open interest stops shrinking, and funding rates rise from negative territory). Third, keep the position at a probe size and place the stop-loss below the low of the bottoming pattern; exit immediately if the price decisively breaks below it. Do not “keep buying as it falls.” If $62,300 is decisively breached, “buying the dip” is no longer an option; only watch and wait, with the next reference zone at $58,000–$59,000.
Right-side confirmation needs to be more robust: a daily close back above $70,000 would only mean the decline has paused. Reclaiming the 200-day moving average near $73,000 would mark the first step toward trend recovery, while a genuine turn toward strength would require holding above $75,000–$76,000. Until then, treat any rally as an oversold bounce: do not chase it or use leverage to bet on a reversal.
ETH trading framework. ETH has shown notably less upside responsiveness than BTC in this move, with a larger weekly decline and a lower low. Its price action follows BTC but lacks independent buying demand, so the strategy should be more conservative: do not make a standalone “risk-reward” case for going long; follow BTC's signals only, and use tighter stop-losses. After losing $2,000, the $1,900–$2,000 zone above has turned from support into resistance. If ETH rebounds into this area without confirmation from volume and price action, it is a window to reduce positions, not add to them.
Three ironclad risk-management rules. First, in a market where longs account for 90% of liquidations, reduce leverage; high leverage has no room to survive in this kind of volatility. Second, do not stubbornly hold onto unrealized profits: if the trend turns against you, reduce your position by half and realize the gains in cash before thinking about the bigger picture. Third, keep ETF flows and futures open interest at the top of your monitoring dashboard. A sustained shift to net ETF inflows, a recovery in stablecoin supply growth, and open interest rising alongside prices—only when all three signals appear together is there evidence of a trend reversal. Until then, a small position or no position is a position in itself.
VI. Risk analysis: prepare for both directions
Downside risk. If $62,300 is decisively breached, technical support becomes sparse, and $58,000–$59,000 or even the year-to-date low of $57,742 could be retested. If the December rate decision results in a larger hike, or inflation data continue to exceed expectations, the double pressure from interest rates and the dollar will persist. If ETFs continue to see net outflows for an eighth or ninth day and stablecoin supply keeps shrinking, rebounds will remain short of fuel. In addition, congestion and delays during the resumption of exchange withdrawals, as well as recurring platform security incidents, are non-price risks; the more concentrated your holdings, the more vulnerable you are.
Upside risk. Deep oversold conditions combined with extreme fear can easily trigger a sharp short-covering rally. If macroeconomic data cools, the Fed's tone turns dovish, or ETF flows reach a turning point, prices could recover far faster than expected. Historically, long-term returns from buying near the 200-week moving average have been reasonable, but that is a statistical pattern measured in years. It makes no promises about “the price over the next three days” and is no reason to use leverage for a short-term trade.
Invalidation conditions. If the price quickly reclaims $70,000 and ETFs simultaneously turn to net inflows, the “trend decline” assessment should be downgraded to a “deep shakeout.” Conversely, if $62,000 is repeatedly breached and liquidations continue to grow, that would indicate deleveraging is not over, and all attempts to buy on the left side should be suspended.
The most honest footnote to this market move is that 93.6% of positions were longs: the market does not lack optimism; it lacks respect for liquidity and leverage. Massive liquidations do not mean a bottom is in, and the end of liquidations does not mean a reversal—it only means one group of traders has left the table, while those who survived still have cards to play. You can speculate on a rebound on the left side, but the medium- to long-term direction requires confirmation from the right-side structure. Trading has never been about who buys the dip earliest, but who can stay at the table.#英伟达正物色新CEO,谁会接替黄仁勋? #加密美股齐跌,下轮反弹的驱动力在哪? #比特币活跃供应盈利占比跌破45% #Kava称异常跨链活动仅限KavaLend #美国现货XRPETF周流出创8个月新高 $BTC


