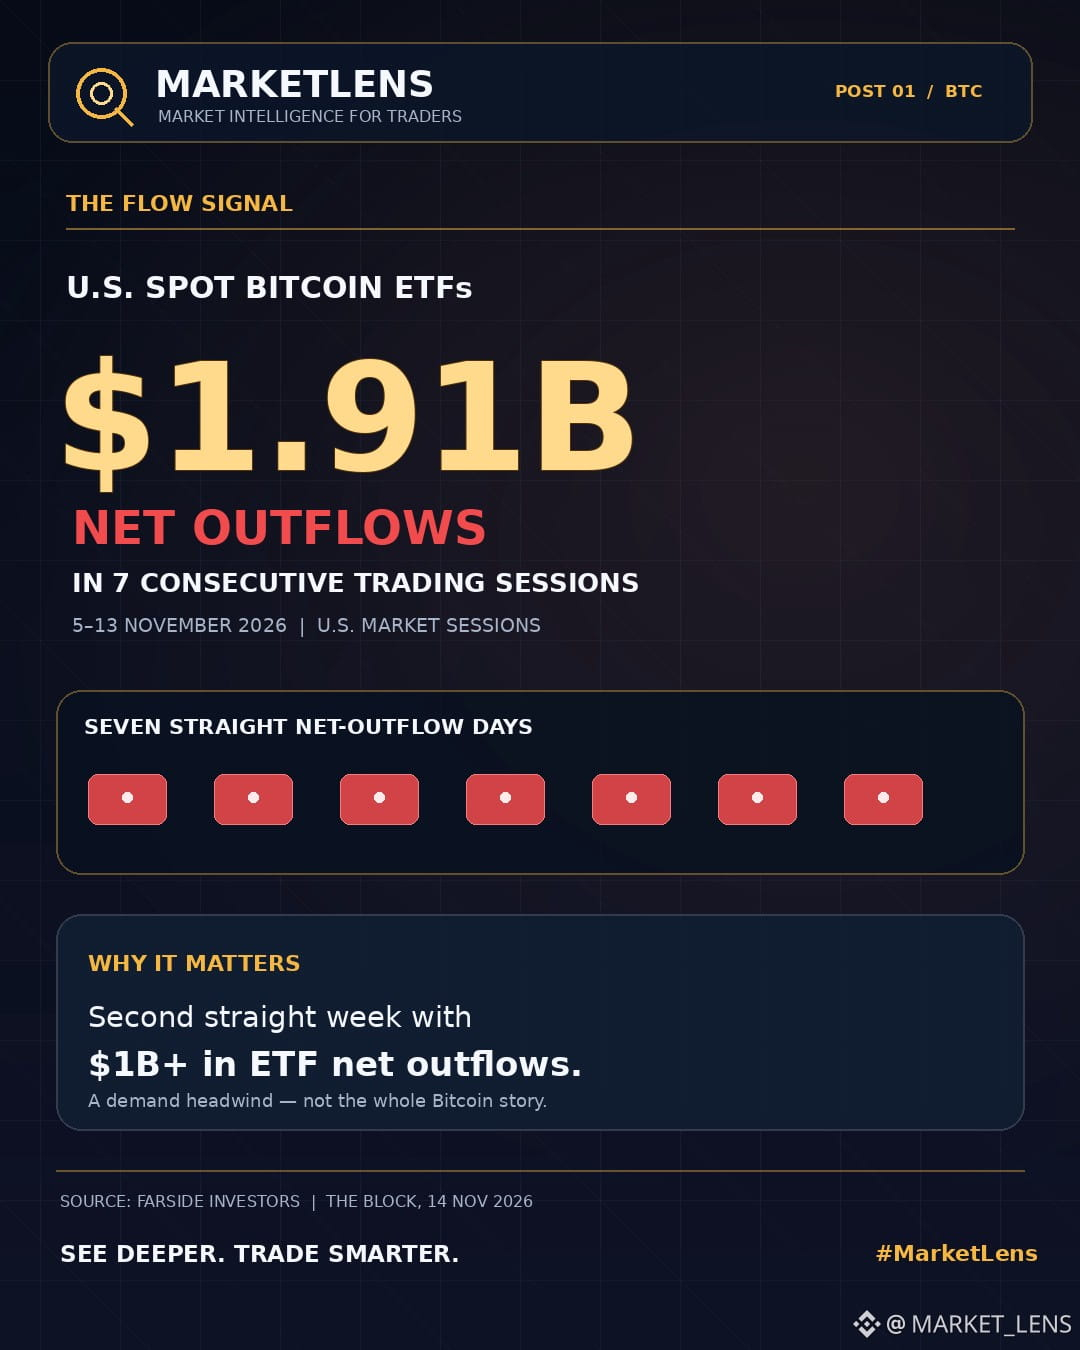
SEVEN STRAIGHT SESSIONS. $1.91 BILLION IN NET OUTFLOWS. BITCOIN ETF DEMAND IS UNDER PRESSURE.
This is no longer just a one-day withdrawal.
U.S. spot Bitcoin ETFs recorded net outflows on seven consecutive trading sessions, from November 5 to November 13, totalling approximately $1.91 billion.
The latest week alone saw around $1.07 billion leave these funds, following $1.28 billion the week before.
That's two consecutive weeks with more than $1 billion in net outflows.
MARKETLENS READ:
This is a meaningful headwind for Bitcoin.
But don't confuse ETF flows with the entire Bitcoin market. These figures don't prove every institution is selling BTC, and they cannot tell us where the bottom is.
What matters next?
• Do ETF outflows start slowing down or turn positive?
• Does genuine spot buying return?
• Can Bitcoin recover its market structure, rather than just print a short-lived relief bounce?
A green candle alone isn't confirmation.
The next flow data and spot-market response will tell us much more.
YOUR TAKE: What would convince you that selling pressure is easing first — positive ETF flows or stronger spot demand on the chart?
Data: Farside Investors | The Block (November 14, 2026).
#Bitcoin #BitcoinETF #CryptoMarkets #MarketLens
This is no longer just a one-day withdrawal.
U.S. spot Bitcoin ETFs recorded net outflows on seven consecutive trading sessions, from November 5 to November 13, totalling approximately $1.91 billion.
The latest week alone saw around $1.07 billion leave these funds, following $1.28 billion the week before.
That's two consecutive weeks with more than $1 billion in net outflows.
MARKETLENS READ:
This is a meaningful headwind for Bitcoin.
But don't confuse ETF flows with the entire Bitcoin market. These figures don't prove every institution is selling BTC, and they cannot tell us where the bottom is.
What matters next?
• Do ETF outflows start slowing down or turn positive?
• Does genuine spot buying return?
• Can Bitcoin recover its market structure, rather than just print a short-lived relief bounce?
A green candle alone isn't confirmation.
The next flow data and spot-market response will tell us much more.
YOUR TAKE: What would convince you that selling pressure is easing first — positive ETF flows or stronger spot demand on the chart?
Data: Farside Investors | The Block (November 14, 2026).
#Bitcoin #BitcoinETF #CryptoMarkets #MarketLens