
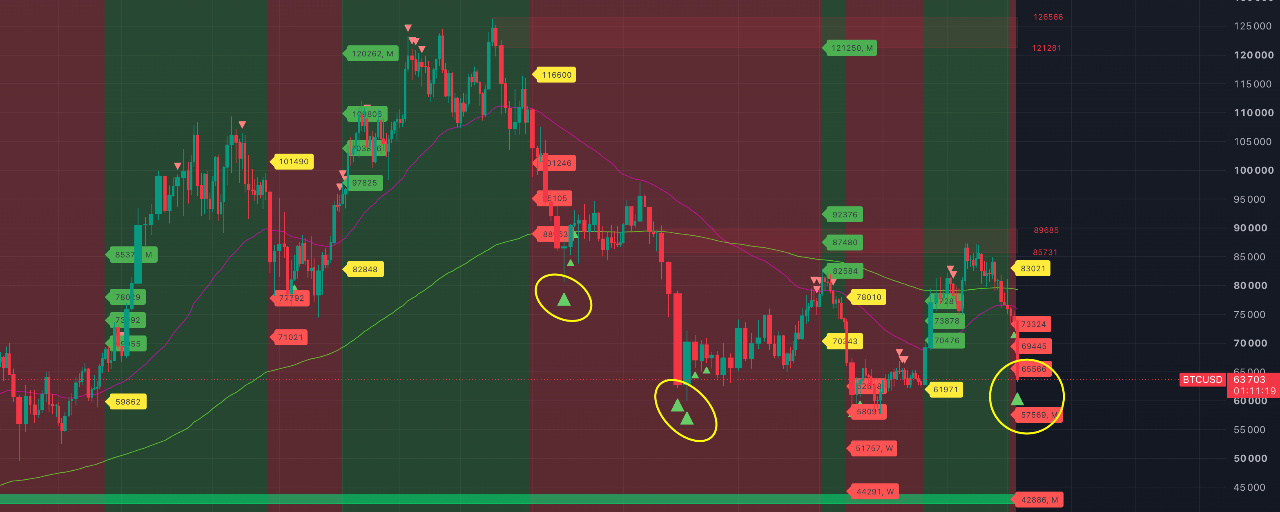


This is the MOST bullish post about BTC in our channel’s history. And a post for the history books—we’ll check back in a year or two.
Anyone who buys Bitcoin right now or in the next three days, at potentially new lows, will most likely be very happy over the next couple of years. Of course, we could be wrong. But there’s nearly a 90% chance we’re right. We didn’t urge anyone to buy Bitcoin at the highs of the recent pump. On the contrary, we urged you to prepare for a correction and a likely dump—remember? And we’re not urging you to buy now either. But we do urge you to study the signals from our indicator, a tool that’s unique in its own way and our own creation, and draw your own conclusions.
Our conclusion: as long as the price of Bitcoin holds a sustained uptrend on the weekly timeframe, we consider current prices ideal for long-term buying. As ideal as it gets.
The reason for optimism is that BTC showed a Strong signal of a potential low on the 3-day timeframe.
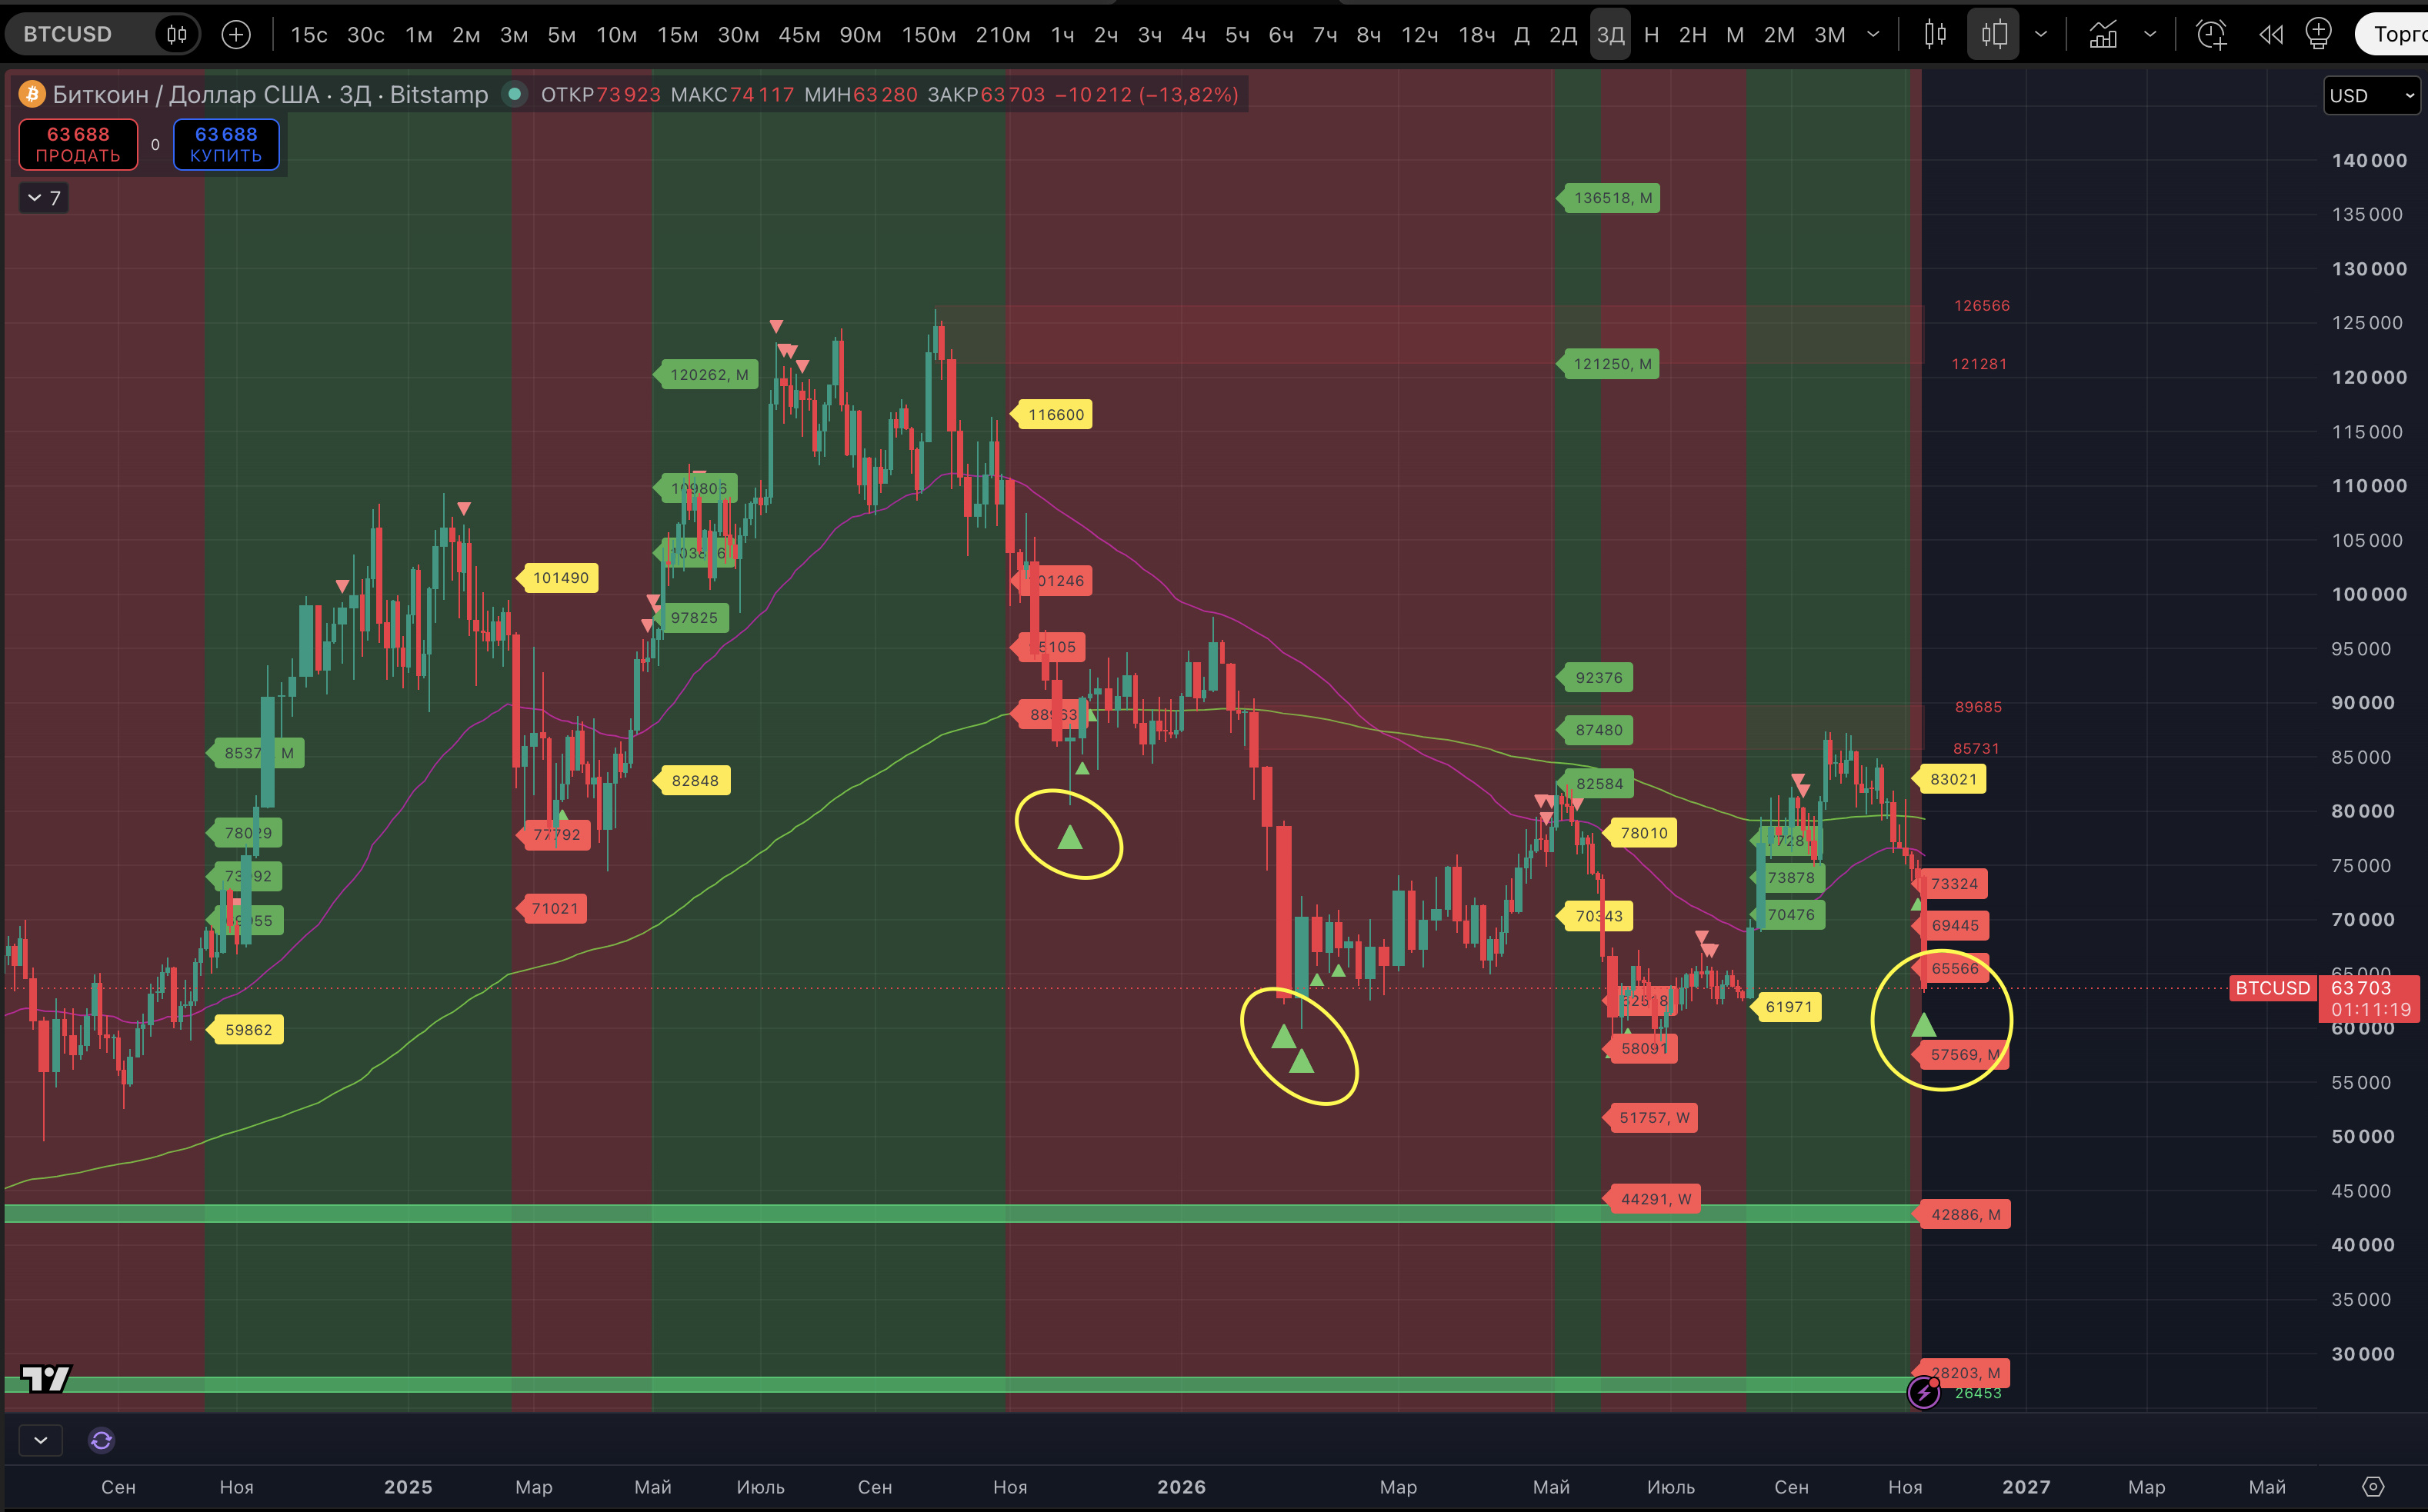
What seemed unlikely just yesterday is a fact today. And for us, it's an unequivocal buy signal. Let's open the #BTC chart on #Bitstamp with its full history and show EVERY instance of this signal in BTC's history.
To assess the significance of this signal, note that over 8 years, since 2018, it has appeared on the chart only four times. There have been just six such signals in the entire history of #BTC.
By the way, this signal appeared twice in this 2025–2026 bear market, which is unusual. The first time, in November 2025, the asset bounced from $80,600 to $97,924, but then continued to decline (which was also unusual based on the asset's history, as we'll discuss below). The asset then showed new Strong signals of a low on the 3-day chart in June 2026, when the price was exactly $60,000. You can see what happened next on the recent chart covering summer and autumn. BUT the previous cycles are much more interesting:
- BEFORE that, the last time this kind of signal appeared was in March 2020, during the COVID crash, at the peak of market FUD. And that was the start of a climb from $3,850 to almost $69,000. Impressive, right? Just wait—there's more.
- BEFORE that, a similar signal appeared in December 2018. And that marked the start of a climb from a low of $3,210 to a high of $13,880 in June 2019.
- BEFORE that, this signal appeared in August 2015, at a low of $198. And then came the rise to $19,666 in December 2017.
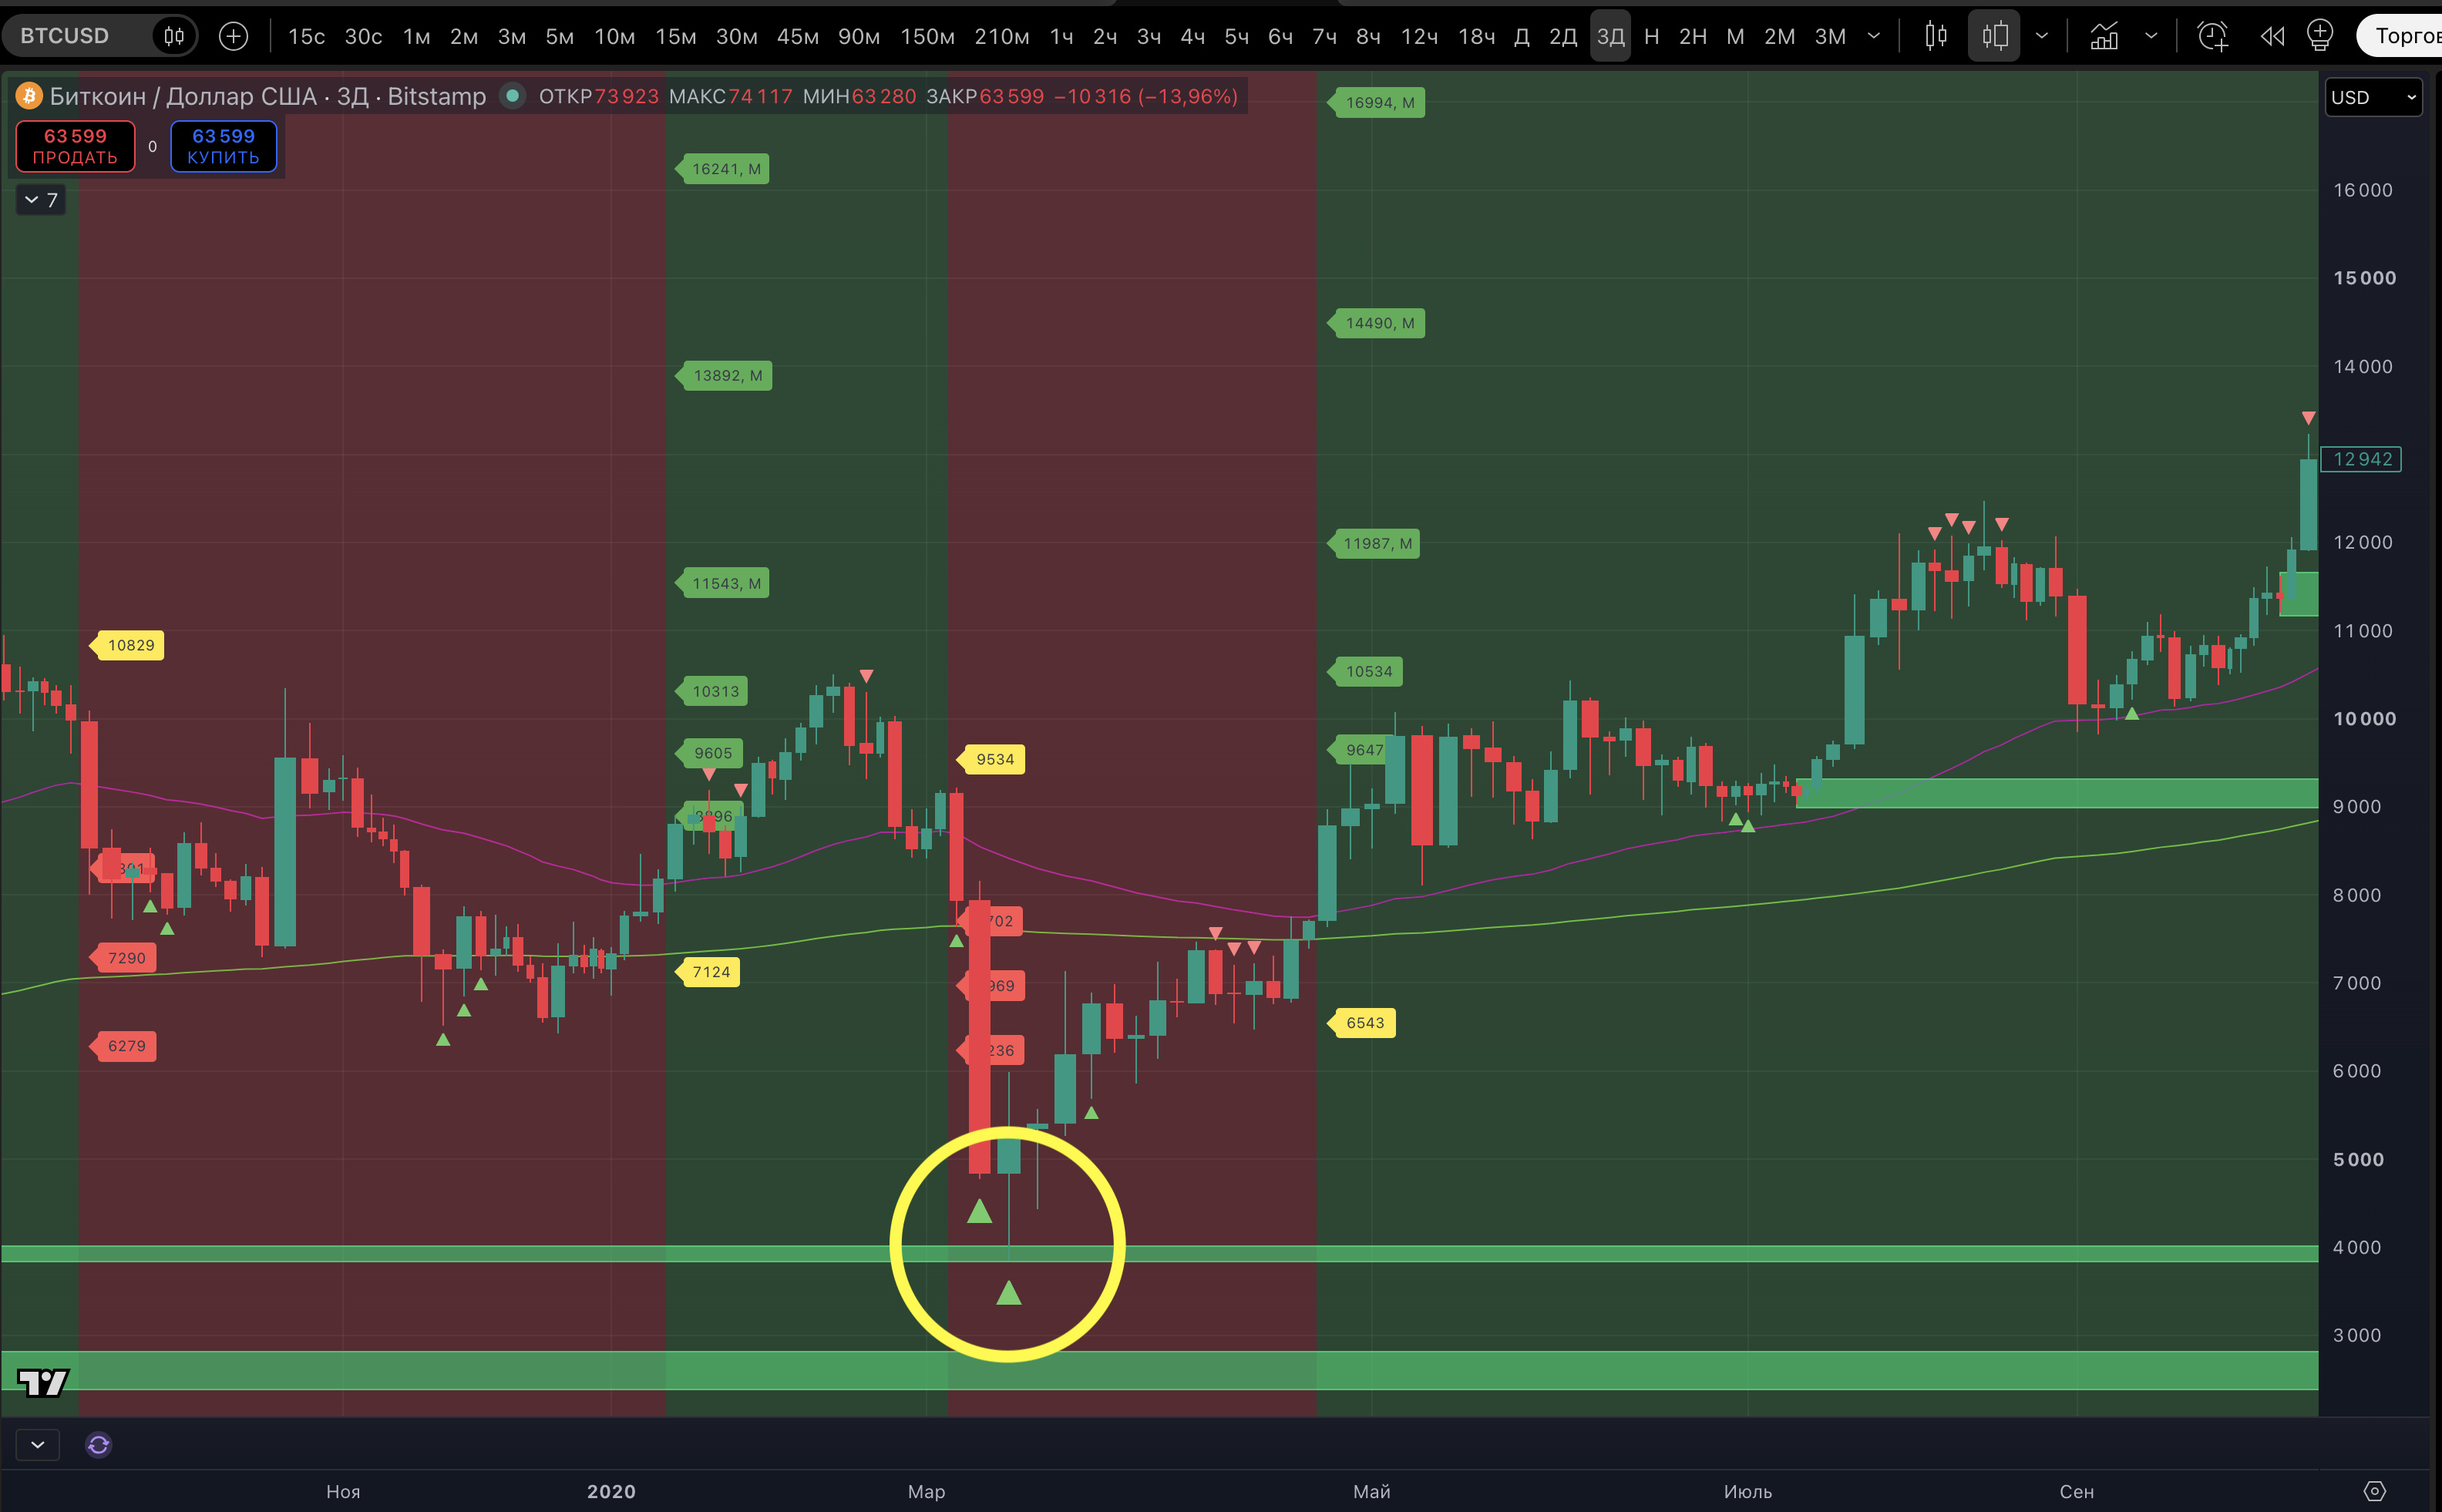
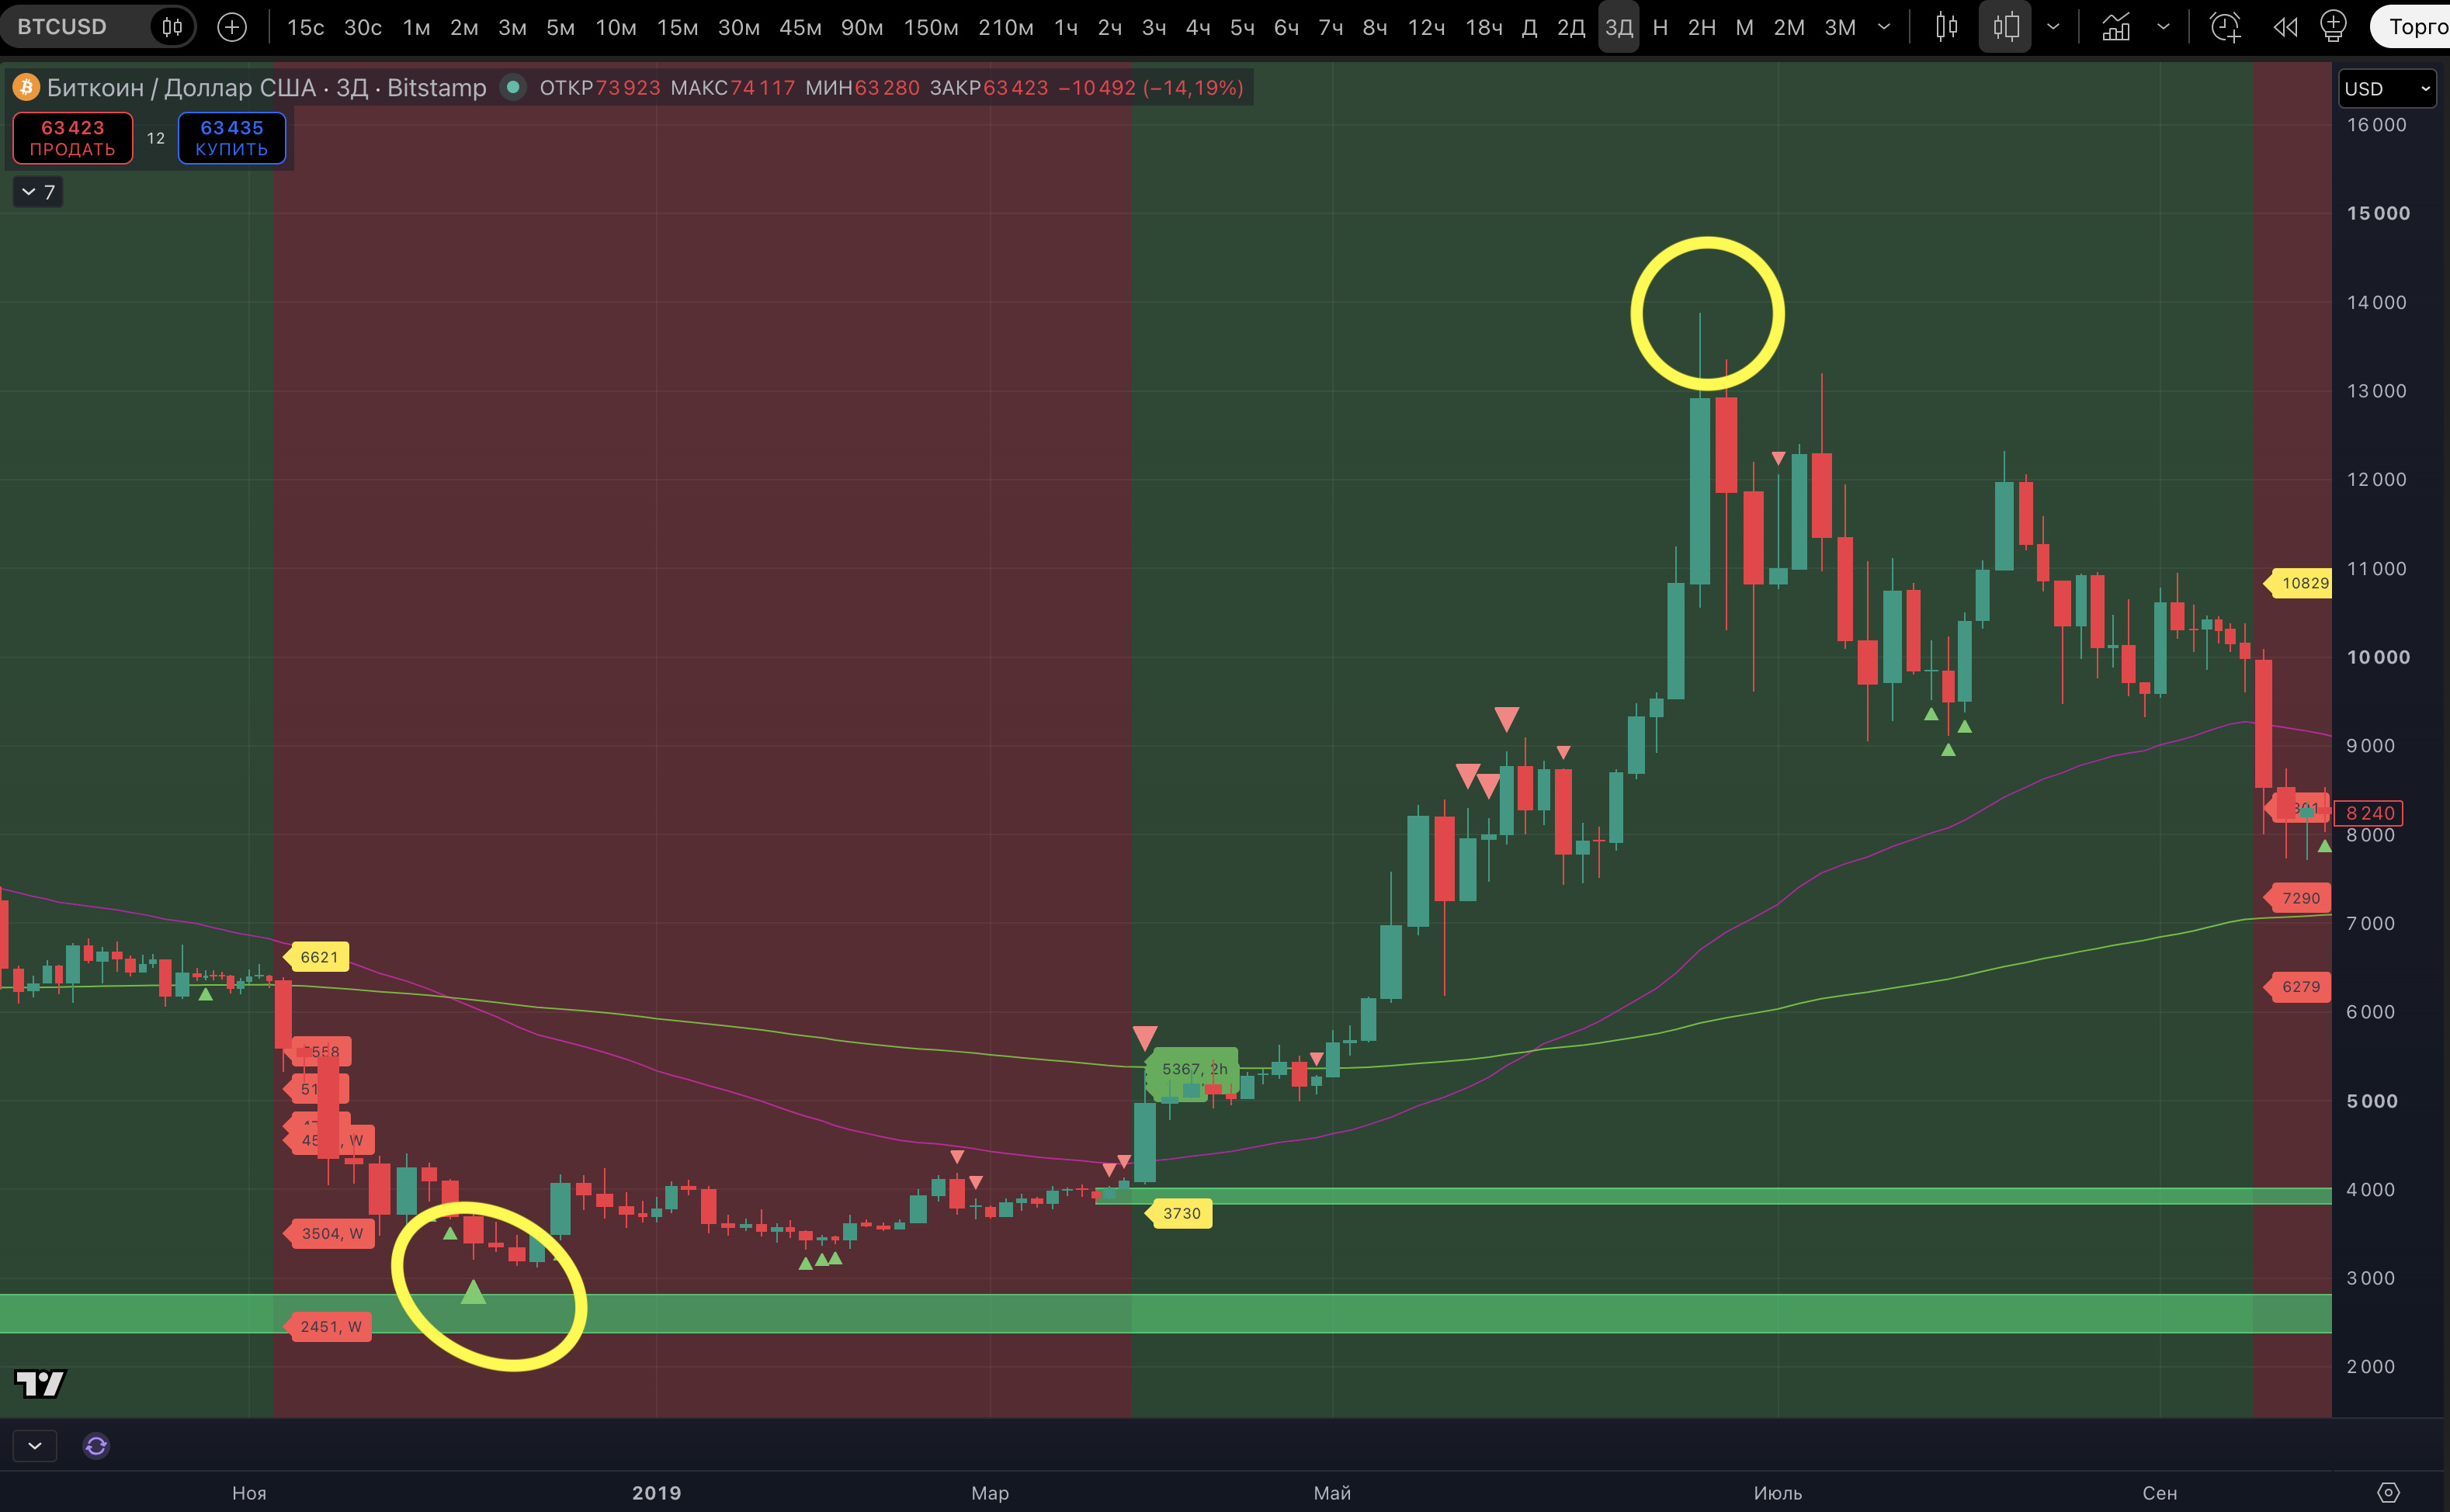
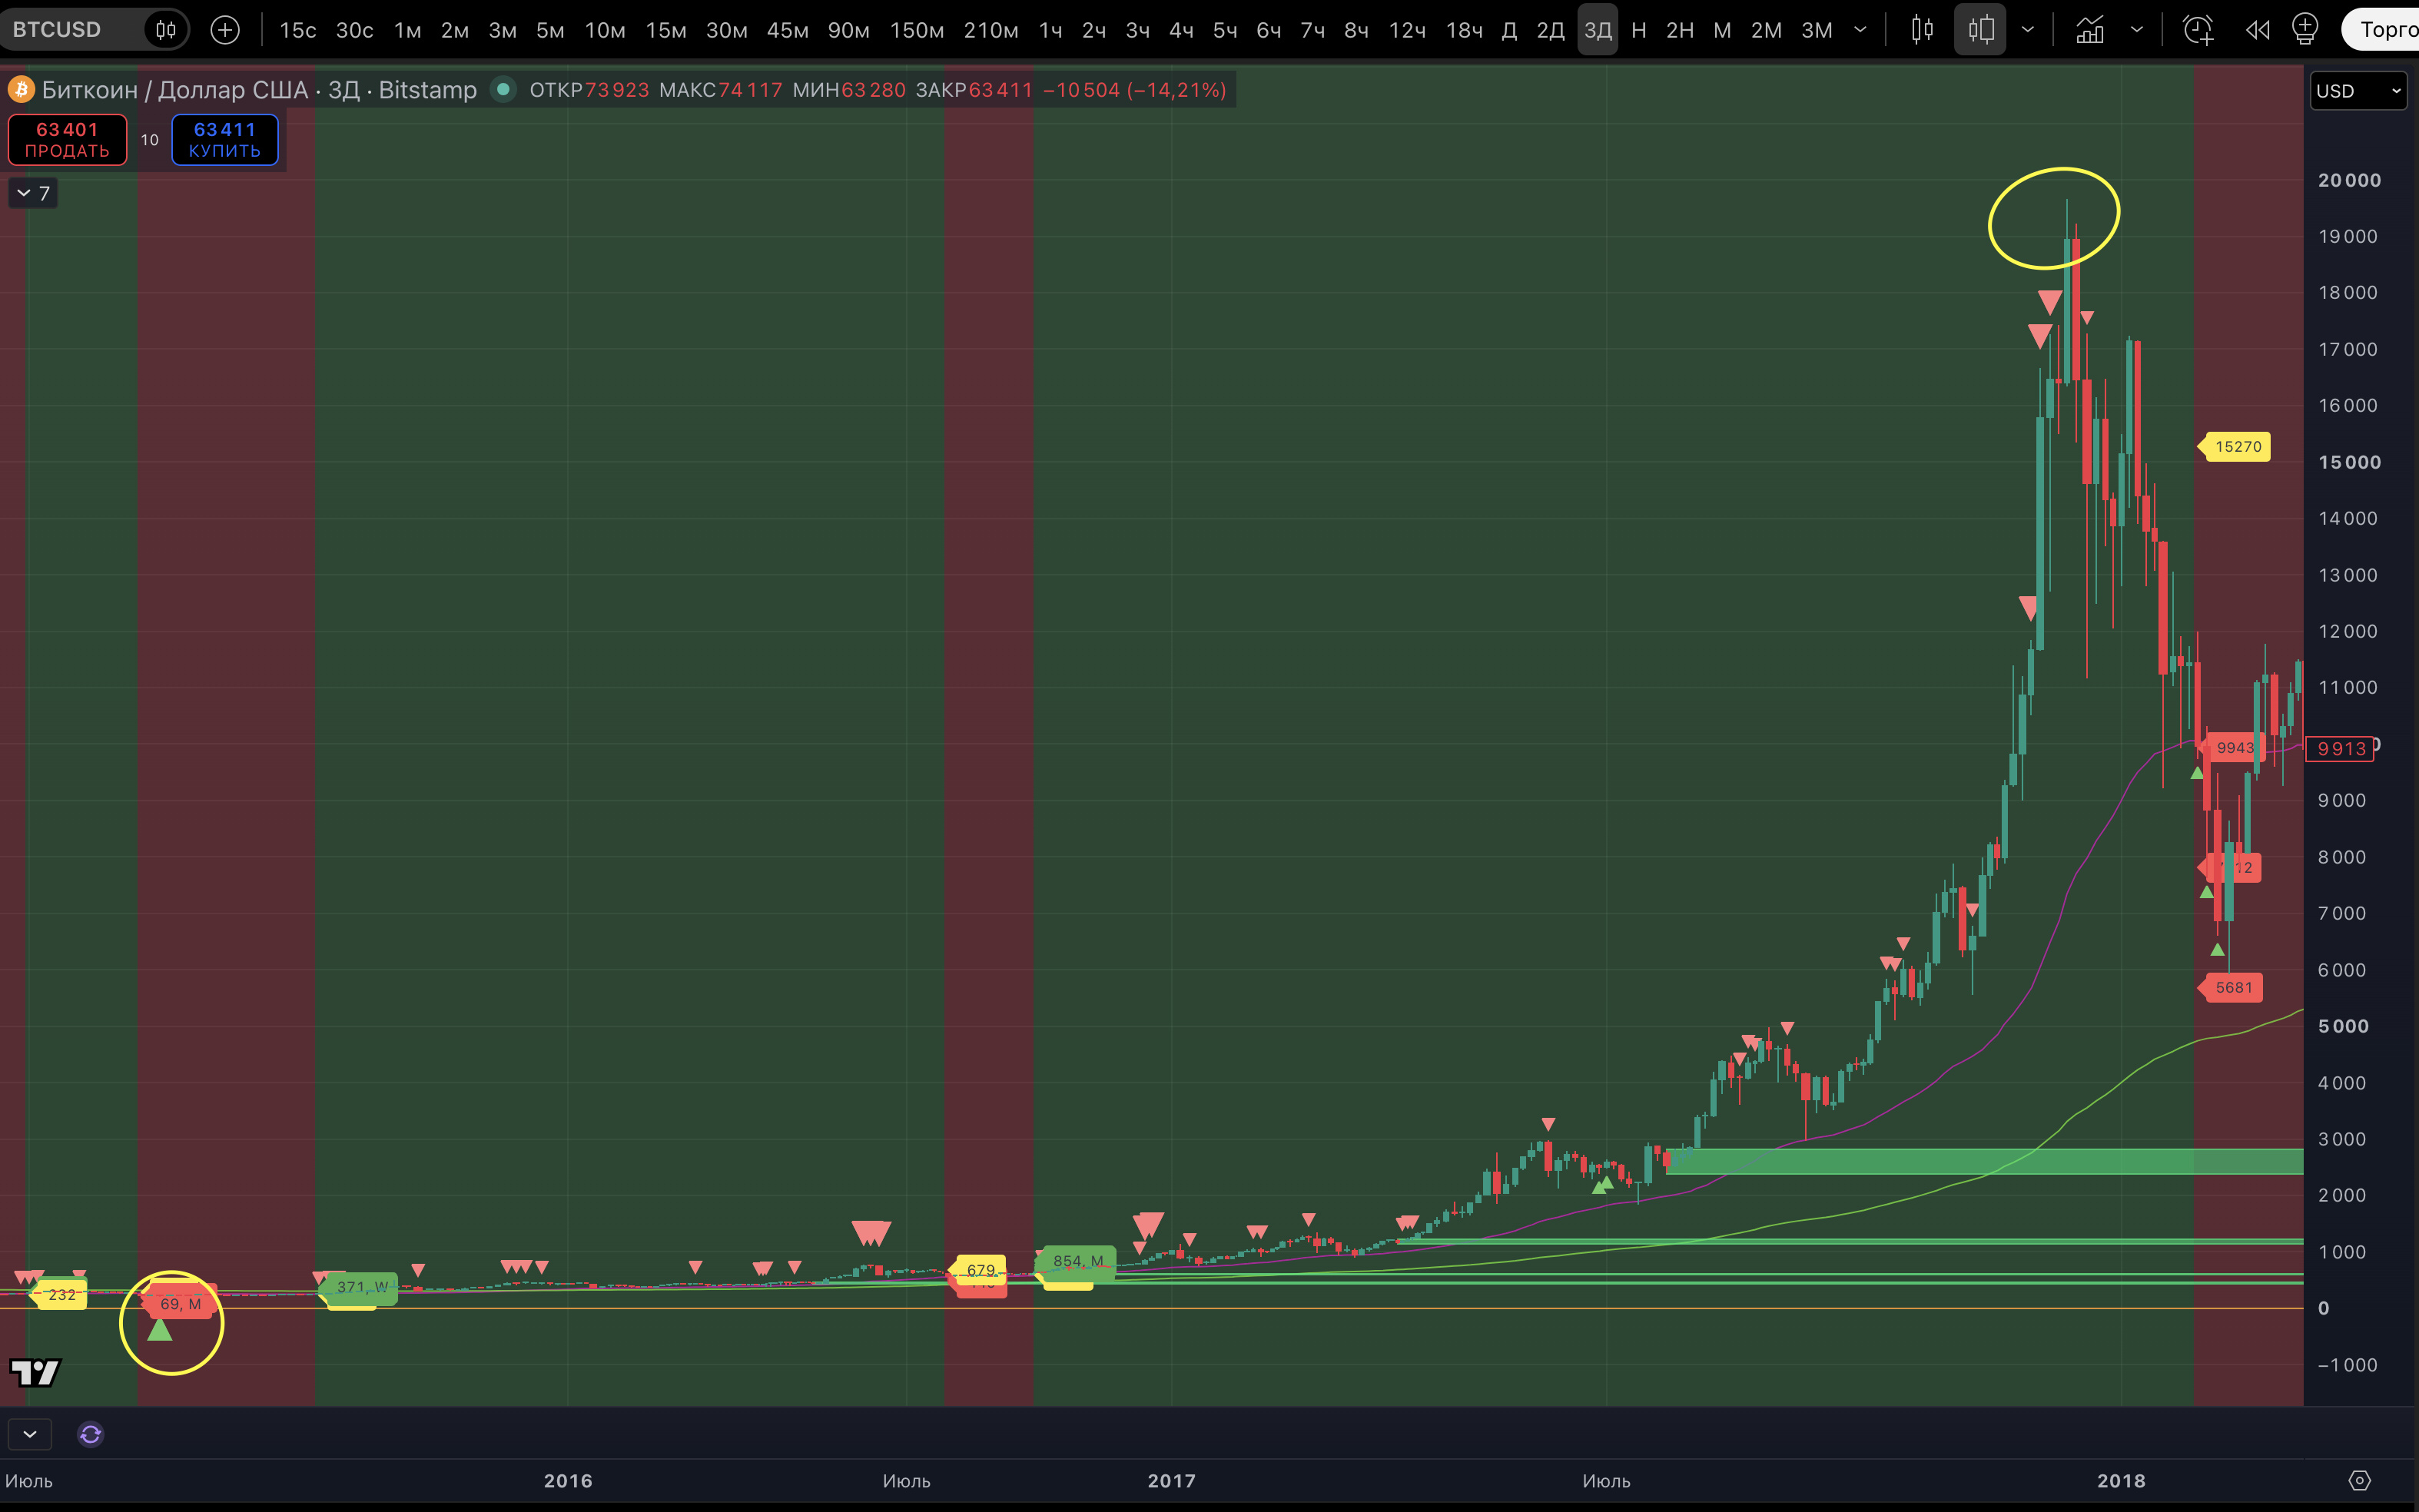
Our conclusion, once again, is that there is no alternative: buy. Either at current prices or on entry long impulses on lower timeframes.
For our conservative investment portfolio, we chose a simple trigger: as soon as a sustained uptrend appears on the 5-minute timeframe, we start buying. This is about another 1/3 of the portfolio in our conservative investment portfolio, where we selected 10 assets and half the portfolio is BTC and ETH.
In less than an hour, the second candle marked on the 3-day timeframe will close, and a new one will open. It will probably be Strong too. The market could potentially fall further on November 16–18. BUT we don't expect the decline to continue after that. And even a decline over the remaining days, at the third marker, is uncertain. So the decision is made: we'll buy more at the first local entry impulse.