#PildorasCrypto10 y #pildorasBinance
RSI AND MACD: LEARN TO READ THE MARKET!
Did you know there are indicators that can help you identify a cryptocurrency’s momentum and possible trend changes?
1. RSI (Relative Strength Index)
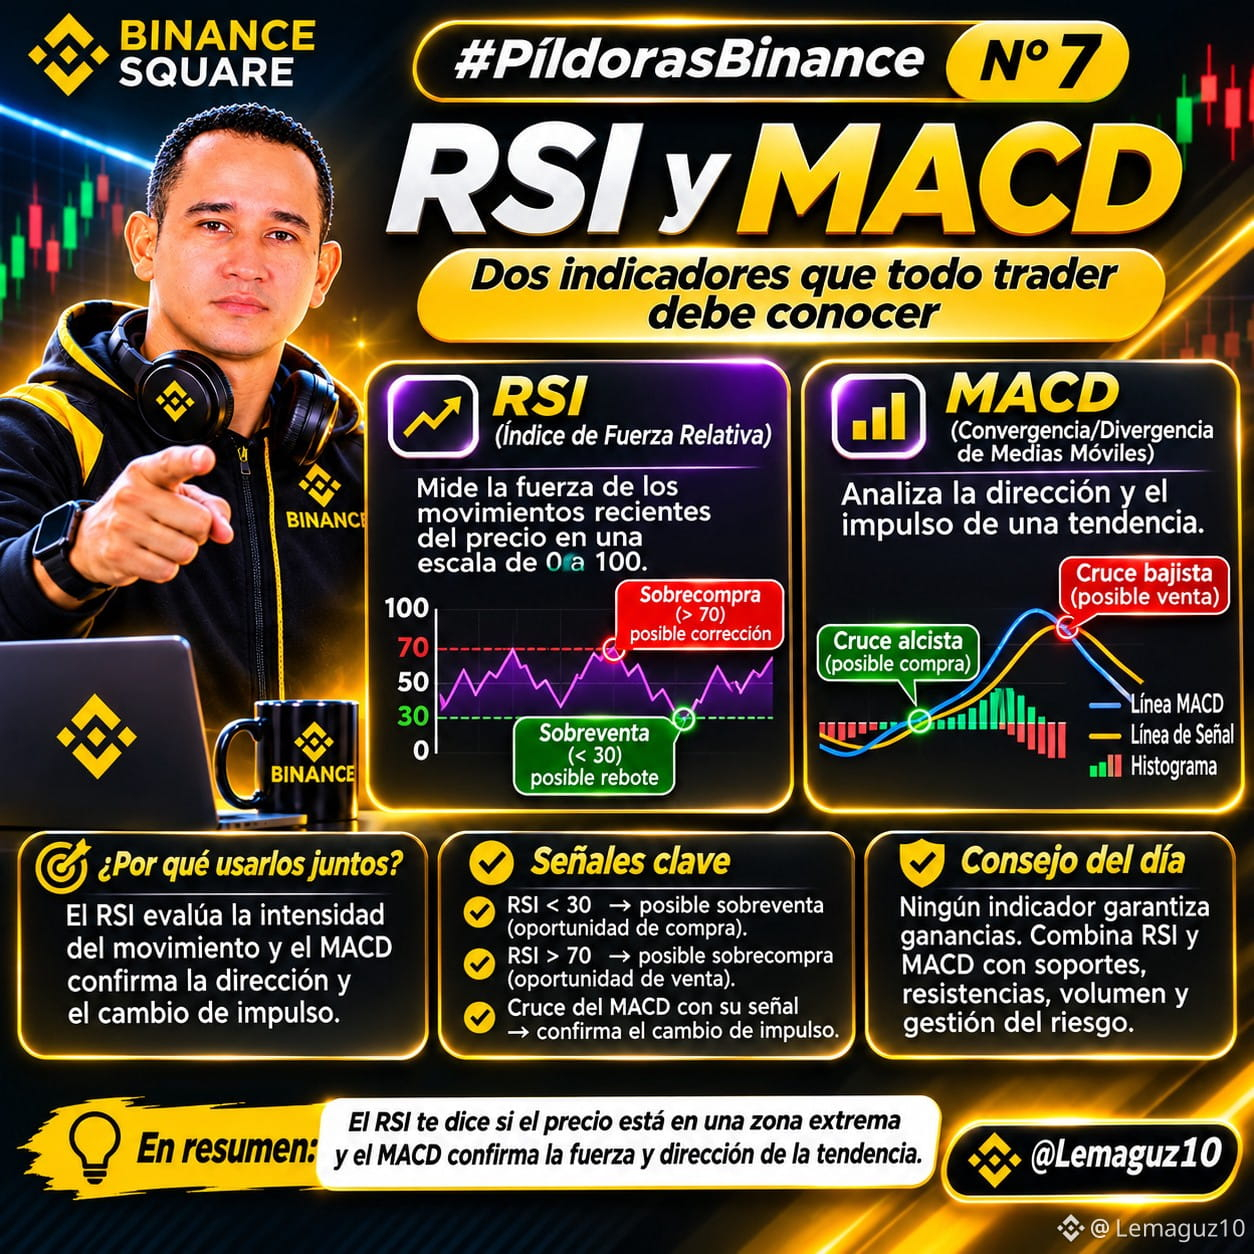
Measures the strength of recent price movements on a scale from 0 to 100.
🟢 RSI below 30: possible oversold conditions.
🔴 RSI above 70: possible overbought conditions.
IMPORTANT: Overbought does not mean the price will fall immediately, nor does oversold mean it will rise.
2. MACD (Moving Average Convergence/Divergence)
Helps analyze the direction and momentum of a trend.
1. MACD crosses above its signal line: possible bullish momentum.
2. MACD crosses below its signal line: possible bearish momentum.
3. The histogram shows the difference between the two lines.
Why use them together?
RSI helps assess the intensity of the movement, while MACD lets you observe changes in momentum and trend.
TIP: No indicator guarantees profits. Combine RSI and MACD with support levels, resistance levels, volume, and risk management before making decisions.
Which do you use more in your analysis: RSI or MACD?
#BinanceSquare
#MACD
#TradingEducativo
@CriptoMaster007
@99PARAGUAYO
@SpaceandTime
RSI AND MACD: LEARN TO READ THE MARKET!
Did you know there are indicators that can help you identify a cryptocurrency’s momentum and possible trend changes?
1. RSI (Relative Strength Index)
Measures the strength of recent price movements on a scale from 0 to 100.
🟢 RSI below 30: possible oversold conditions.
🔴 RSI above 70: possible overbought conditions.
IMPORTANT: Overbought does not mean the price will fall immediately, nor does oversold mean it will rise.
2. MACD (Moving Average Convergence/Divergence)
Helps analyze the direction and momentum of a trend.
1. MACD crosses above its signal line: possible bullish momentum.
2. MACD crosses below its signal line: possible bearish momentum.
3. The histogram shows the difference between the two lines.
Why use them together?
RSI helps assess the intensity of the movement, while MACD lets you observe changes in momentum and trend.
TIP: No indicator guarantees profits. Combine RSI and MACD with support levels, resistance levels, volume, and risk management before making decisions.
Which do you use more in your analysis: RSI or MACD?
#BinanceSquare
#MACD
#TradingEducativo
@CriptoMaster007
@99PARAGUAYO
@SpaceandTime