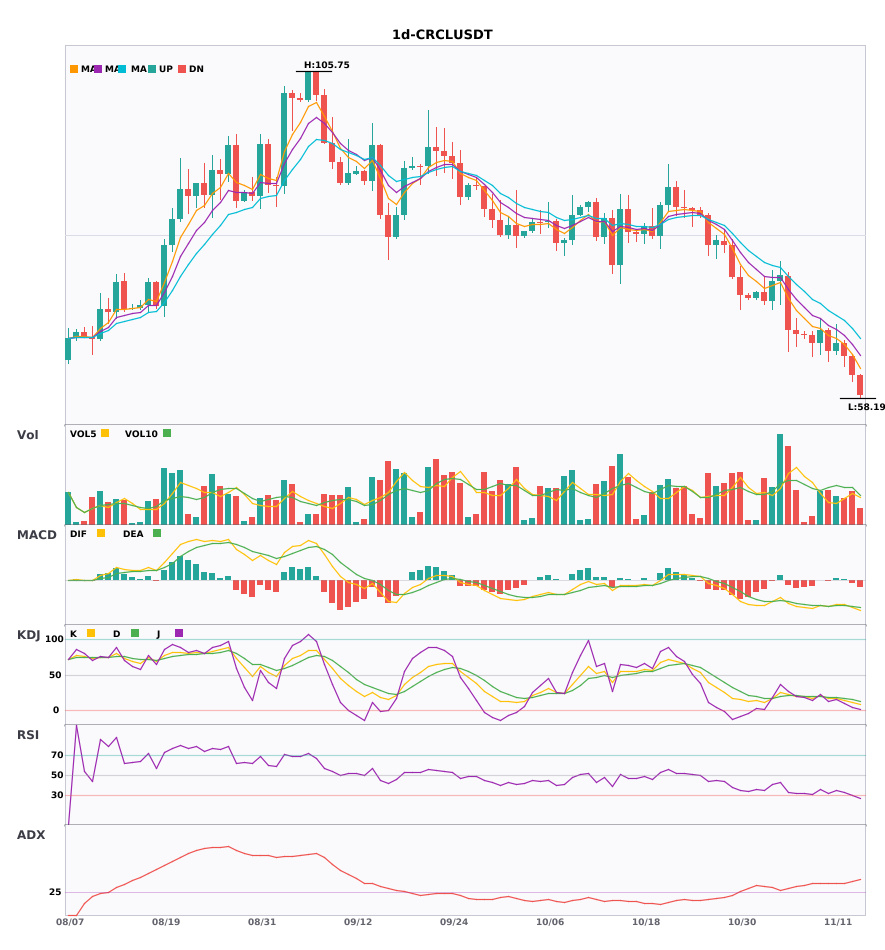
$CRCL daily chart is turning bearish, under short-term pressure. Watch out for pullback risk 🔥
════════════════════
🟢 $CRCL daily chart: bearish signal
⚠️Technical analysis: ADX at 39 indicates a strong trend. MACD is below zero with a bearish crossover, showing strengthening selling pressure. Moving averages have just formed a bearish alignment. KDJ is oversold, so watch for a possible rebound. Volume is down to 0.9x.
════════════════════
🔔 Follow for the latest market moves 🔔
#技术分析 #CRCL
📌 When trading, pay attention to whether the candlestick patterns confirm the signal.
════════════════════
🟢 $CRCL daily chart: bearish signal
⚠️Technical analysis: ADX at 39 indicates a strong trend. MACD is below zero with a bearish crossover, showing strengthening selling pressure. Moving averages have just formed a bearish alignment. KDJ is oversold, so watch for a possible rebound. Volume is down to 0.9x.
════════════════════
🔔 Follow for the latest market moves 🔔
#技术分析 #CRCL
📌 When trading, pay attention to whether the candlestick patterns confirm the signal.