🔴 $ZEC /USDT · Bias: SHORT
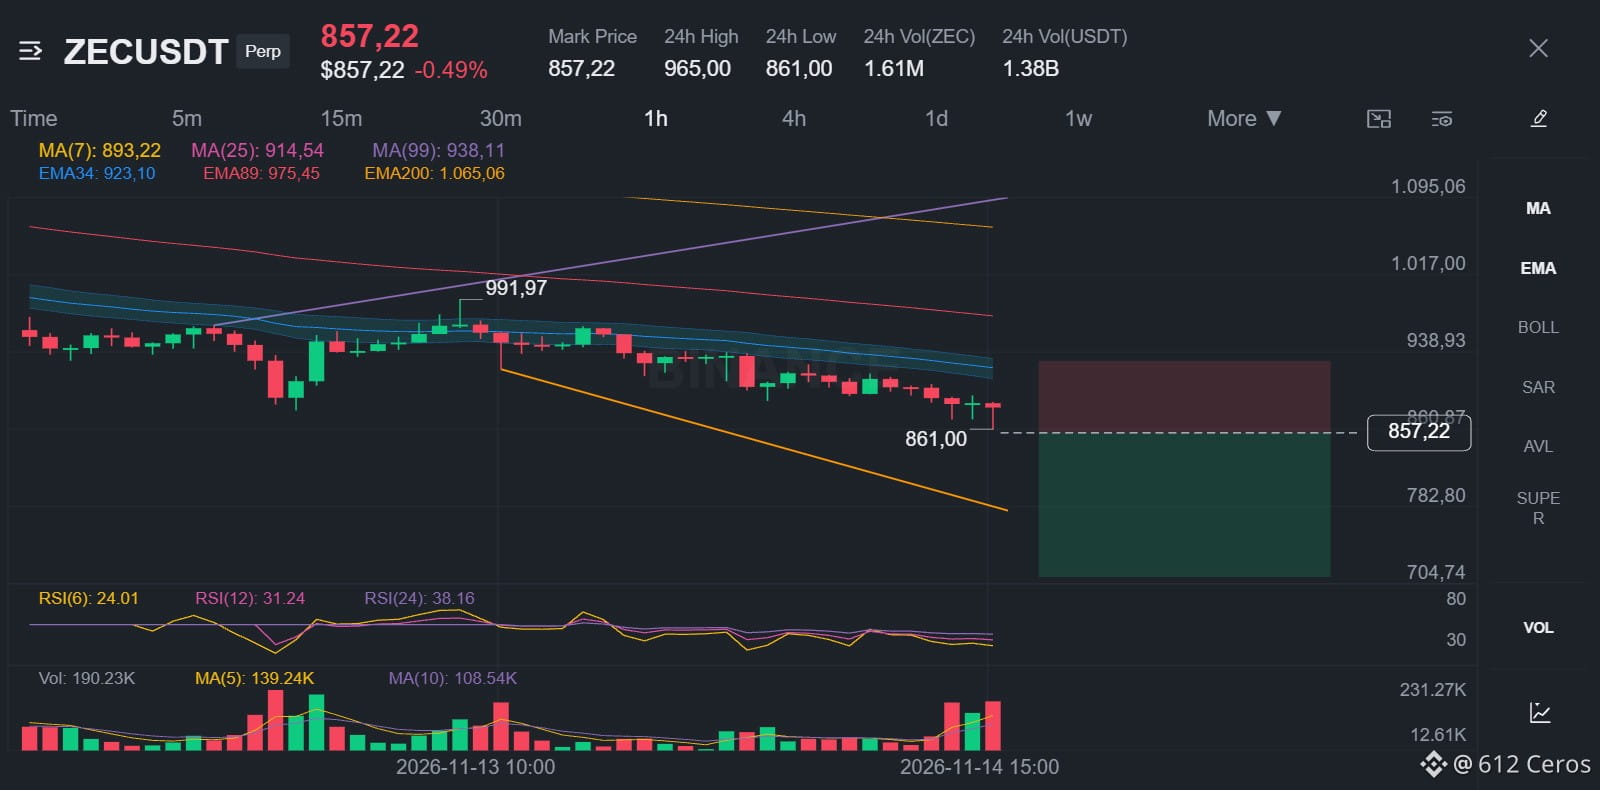
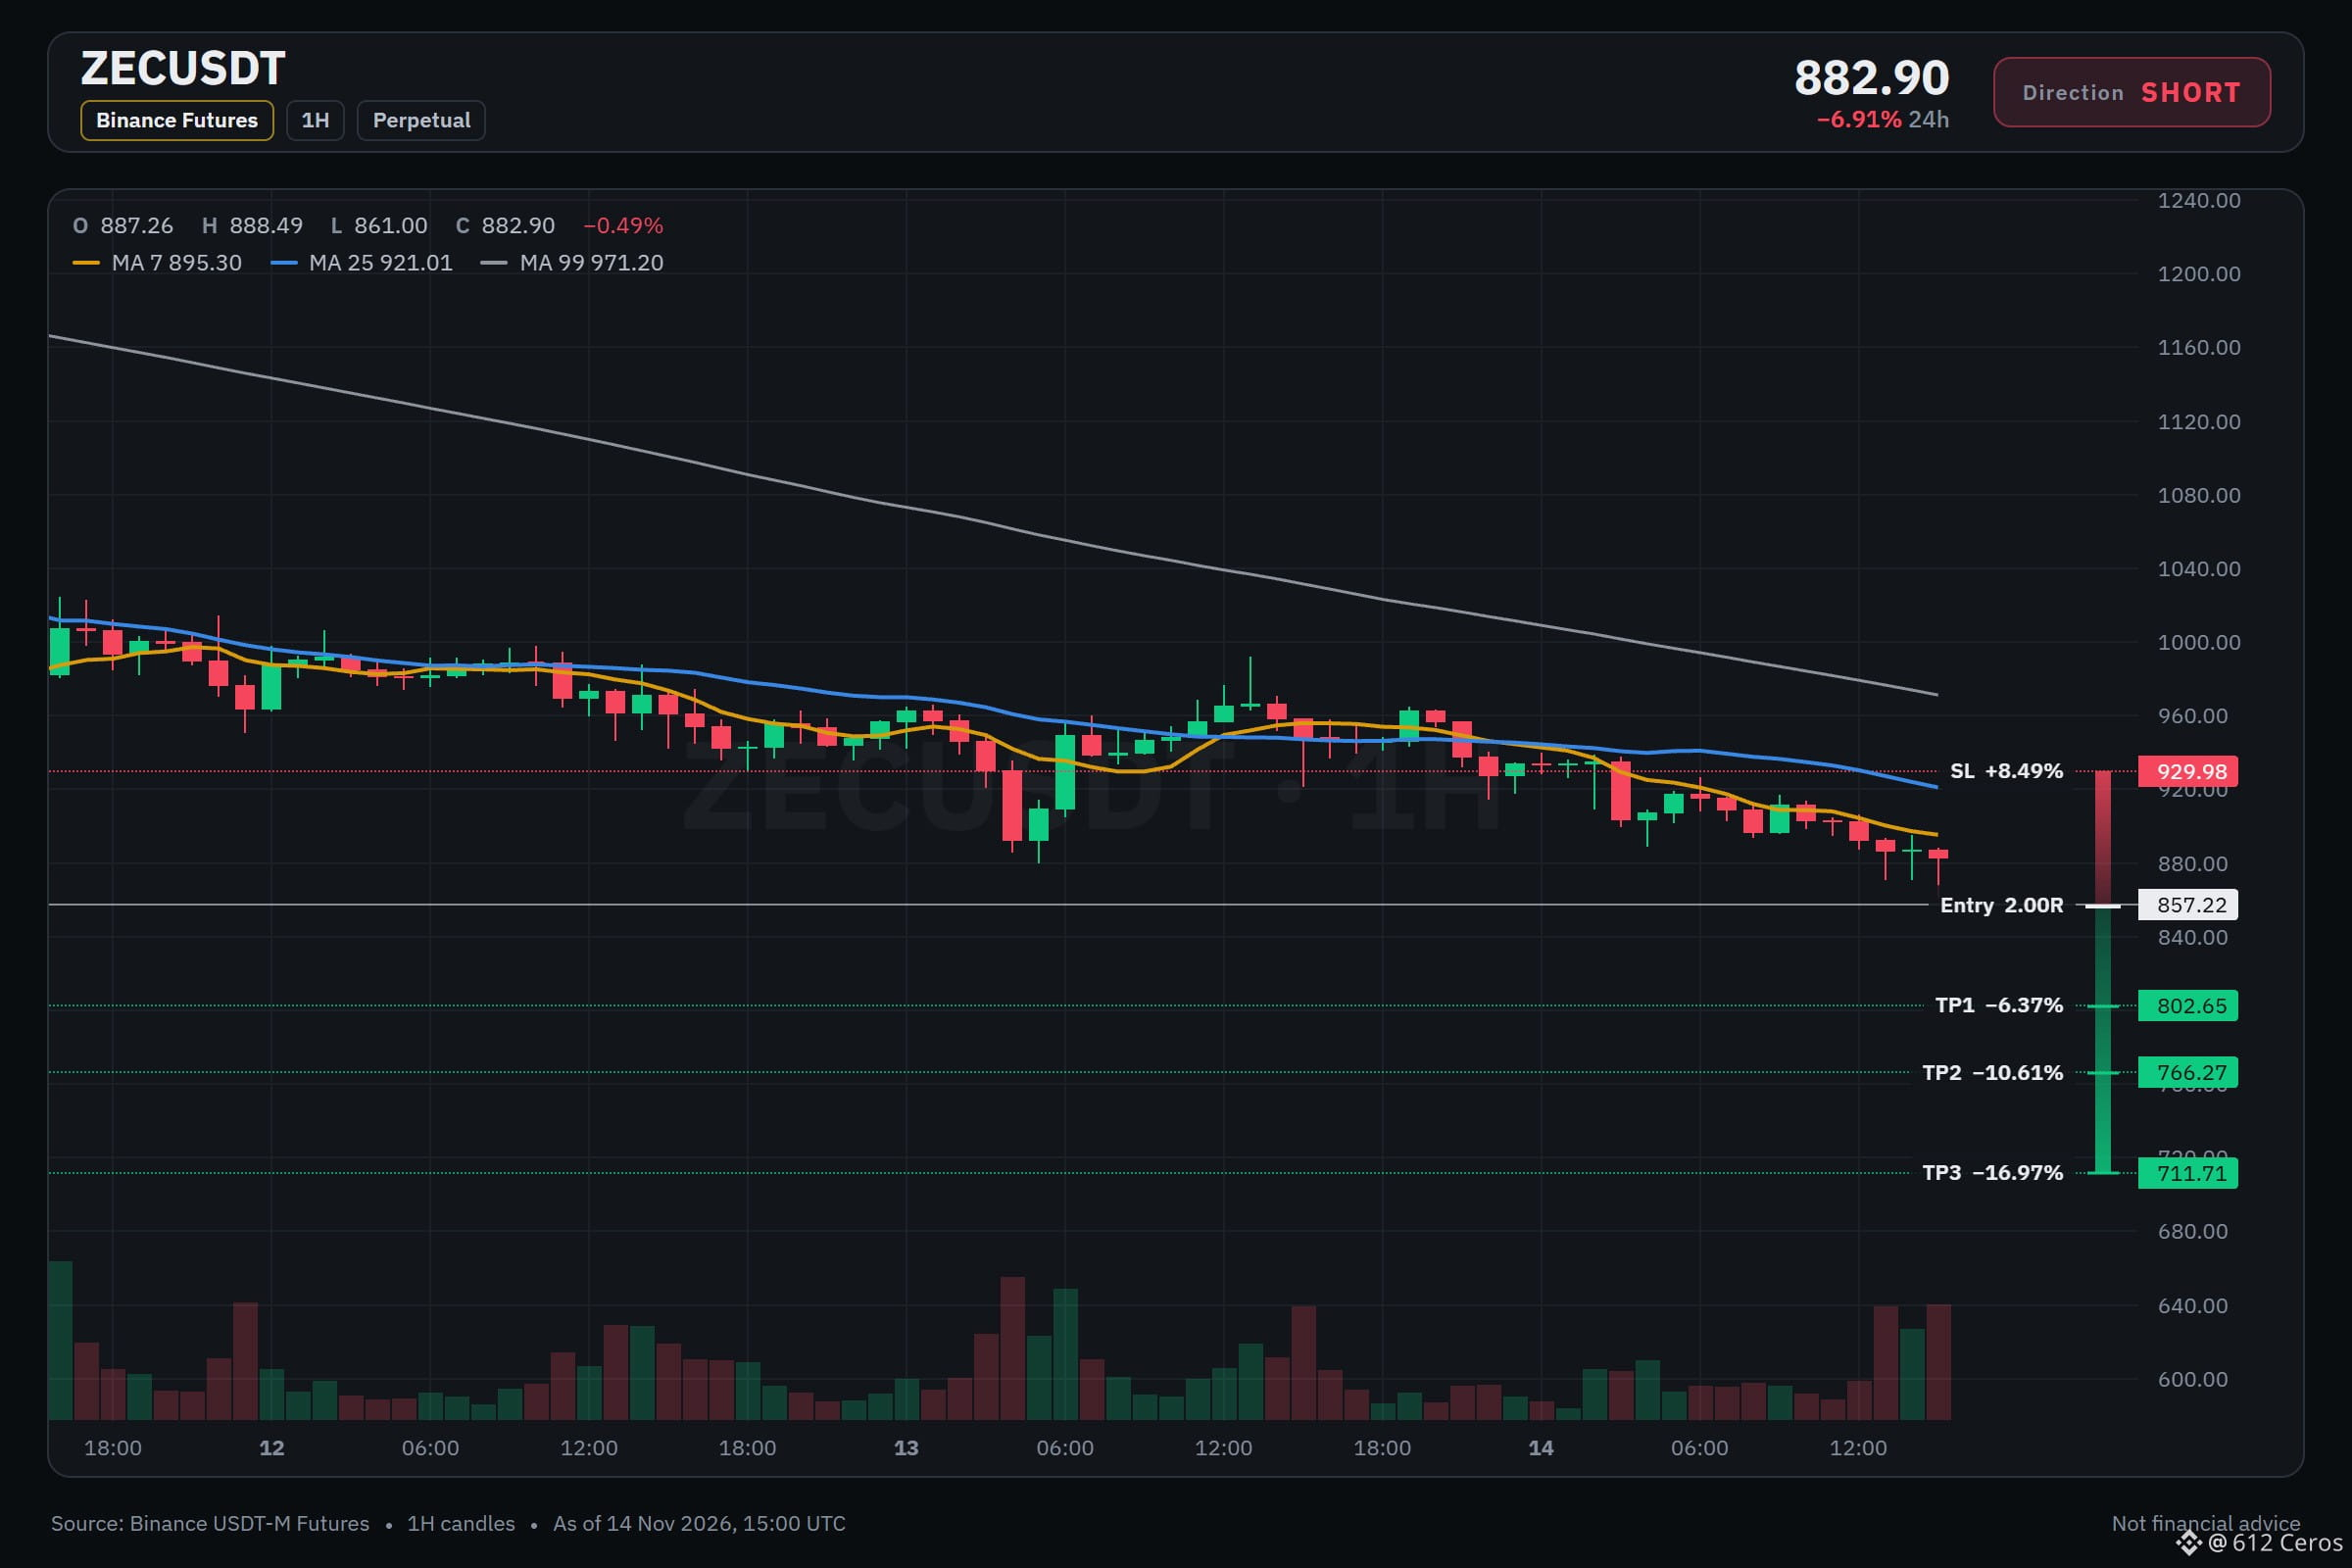
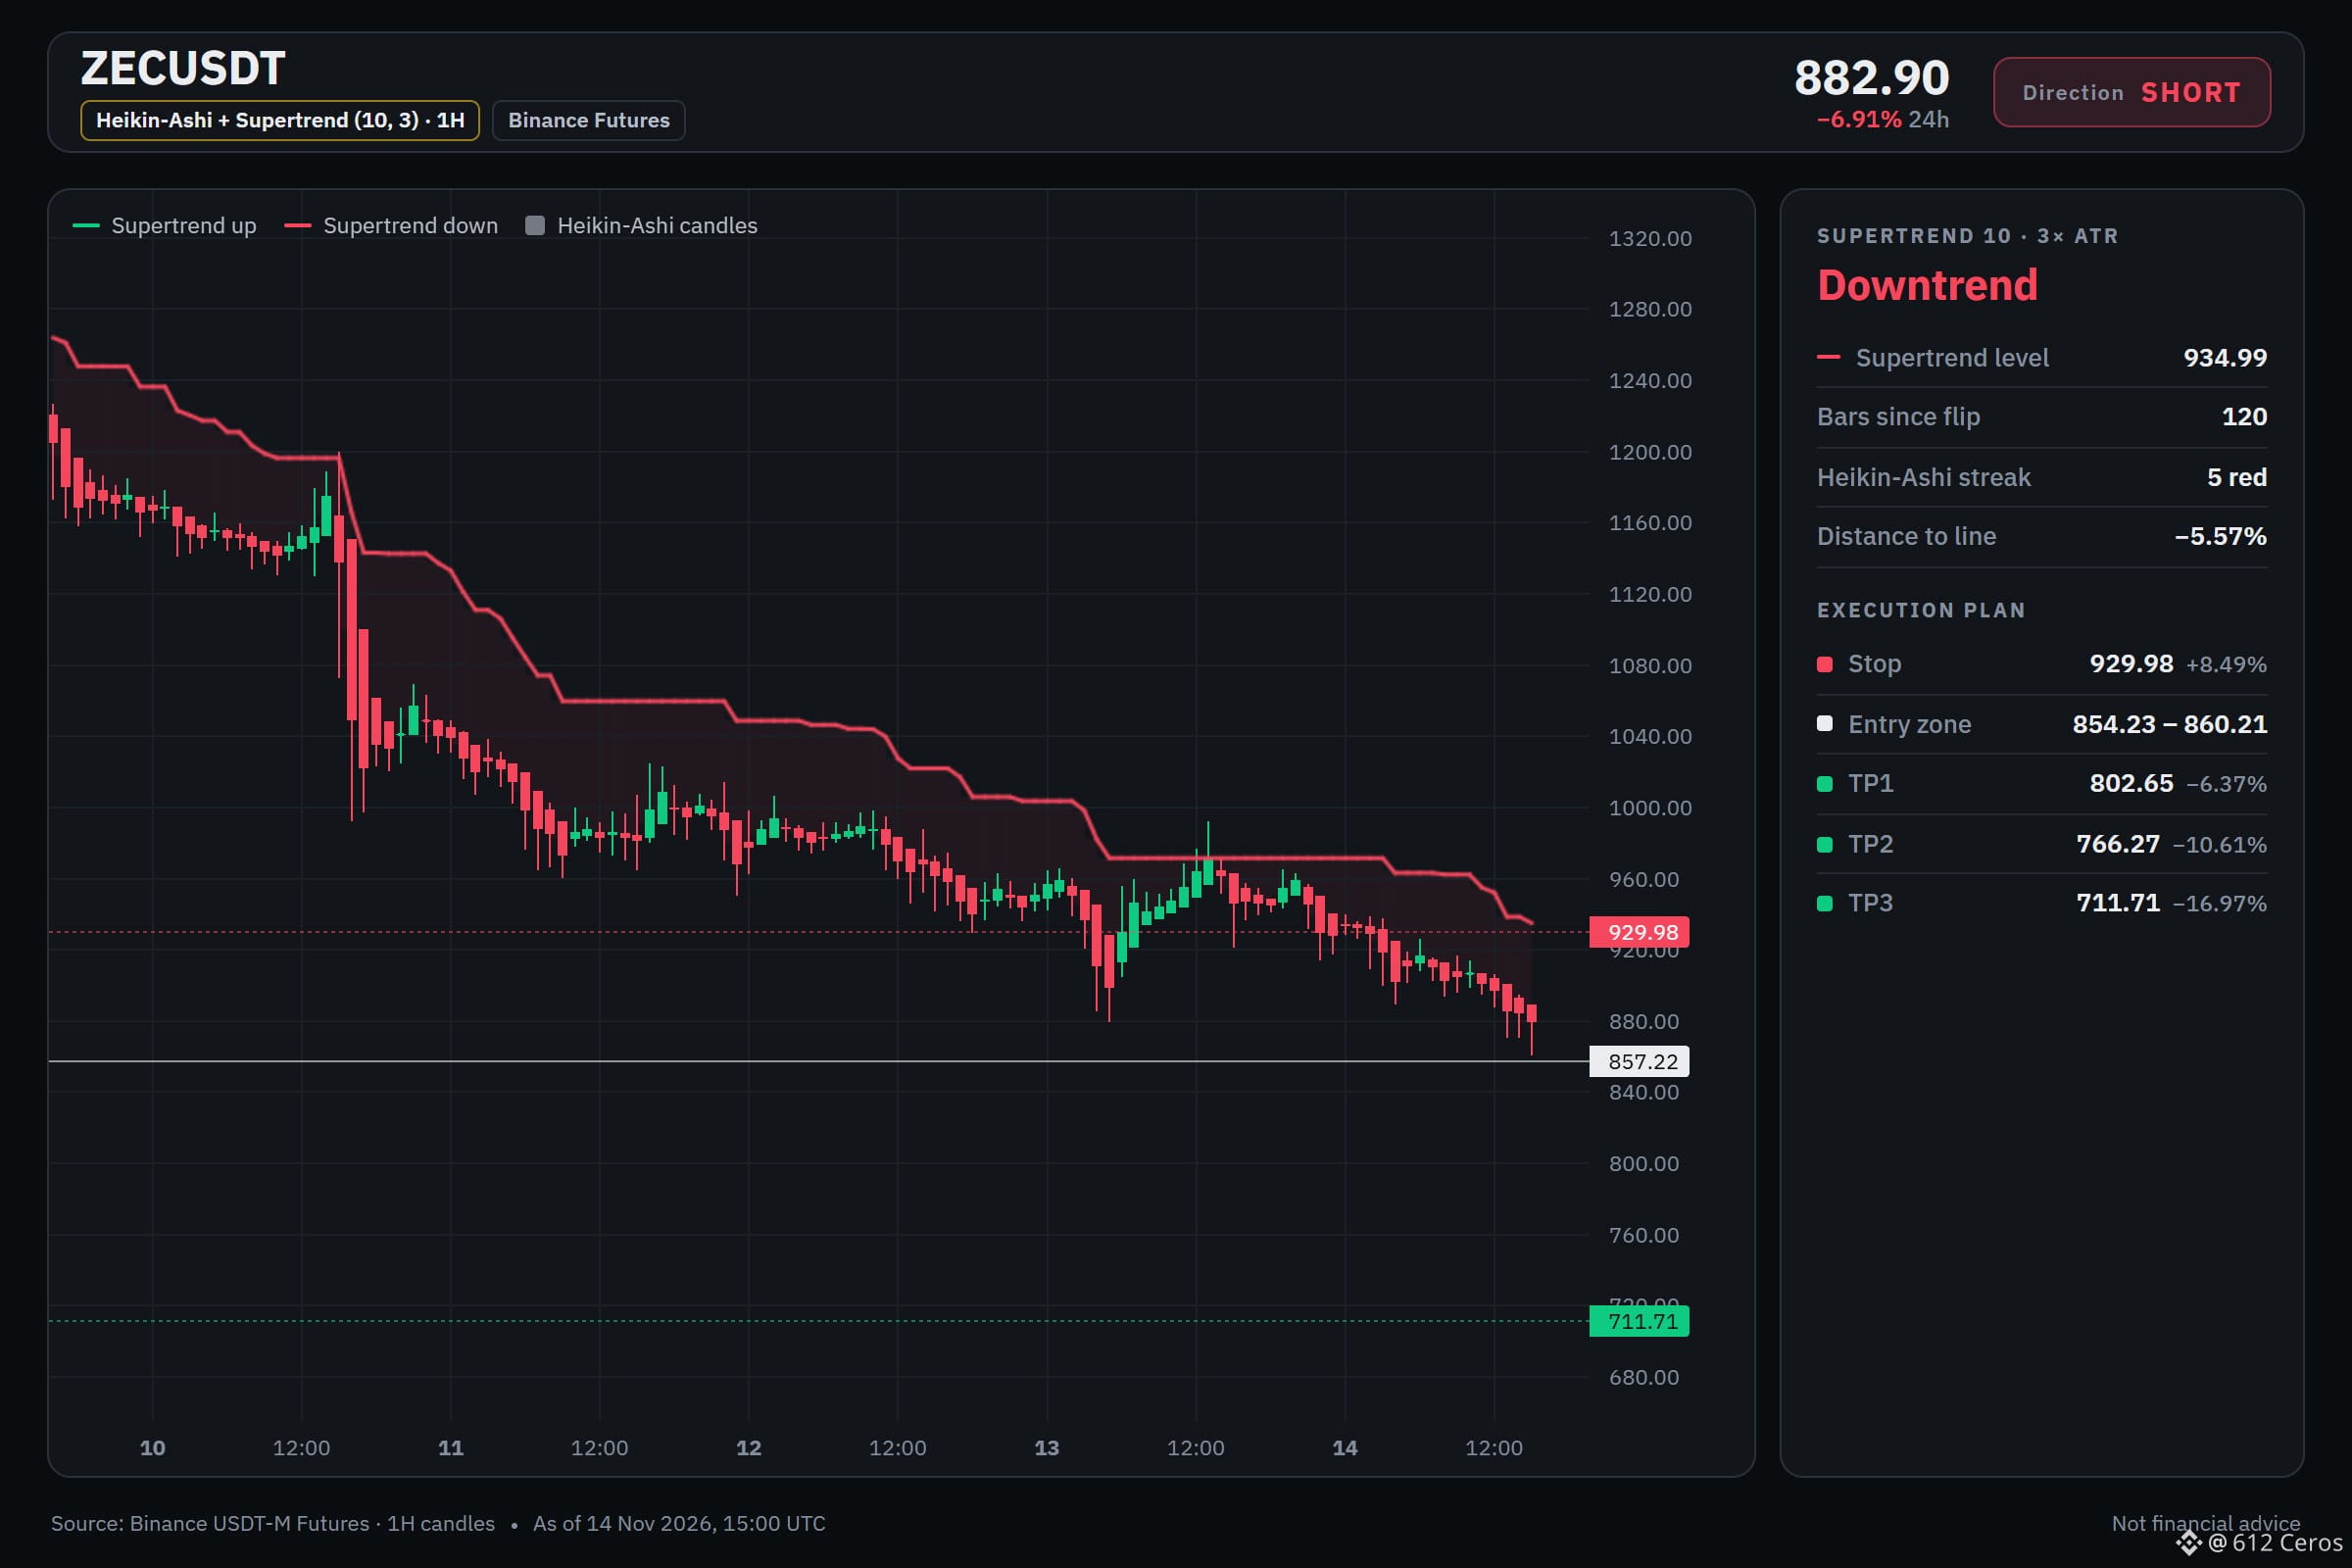
4h and 1h charts show stacked bearish EMAs, so the swing trend is down.
Entry: 854.23 – 860.21
TP1: 802.65 (-6.4%)
TP2: 766.27 (-10.6%)
TP3: 711.71 (-17.0%)
SL: 929.98 (+8.5%)
Why: the 4h trend shows price below a bearish EMA stack, meaning the short-term trend is down.
Risk: Far below its average, bounce likely (−4.0 ATR from 1h EMA50)
Plan: close 50% at TP1, 25% at TP2, 25% at TP3, and move the stop to entry after TP1.
Do you see a short here or wait?
⚠️ Personal market analysis only. NFA — manage risk and DYOR.
Educational content, not investment advice or a recommendation to buy, sell, deposit, or withdraw any asset. No paid promotion or referral/affiliate links.
4h and 1h charts show stacked bearish EMAs, so the swing trend is down.
Entry: 854.23 – 860.21
TP1: 802.65 (-6.4%)
TP2: 766.27 (-10.6%)
TP3: 711.71 (-17.0%)
SL: 929.98 (+8.5%)
Why: the 4h trend shows price below a bearish EMA stack, meaning the short-term trend is down.
Risk: Far below its average, bounce likely (−4.0 ATR from 1h EMA50)
Plan: close 50% at TP1, 25% at TP2, 25% at TP3, and move the stop to entry after TP1.
Do you see a short here or wait?
⚠️ Personal market analysis only. NFA — manage risk and DYOR.
Educational content, not investment advice or a recommendation to buy, sell, deposit, or withdraw any asset. No paid promotion or referral/affiliate links.