

Let's analyze the current chart situation! The KAVA (Kava) trading pair, in the “Tier 1 / Tier 2” category, experienced a rapid vertical sell-off today, losing -52.67% in 24 hours and trading at 0.03229 USDT.
Key metrics and technical chart overview:
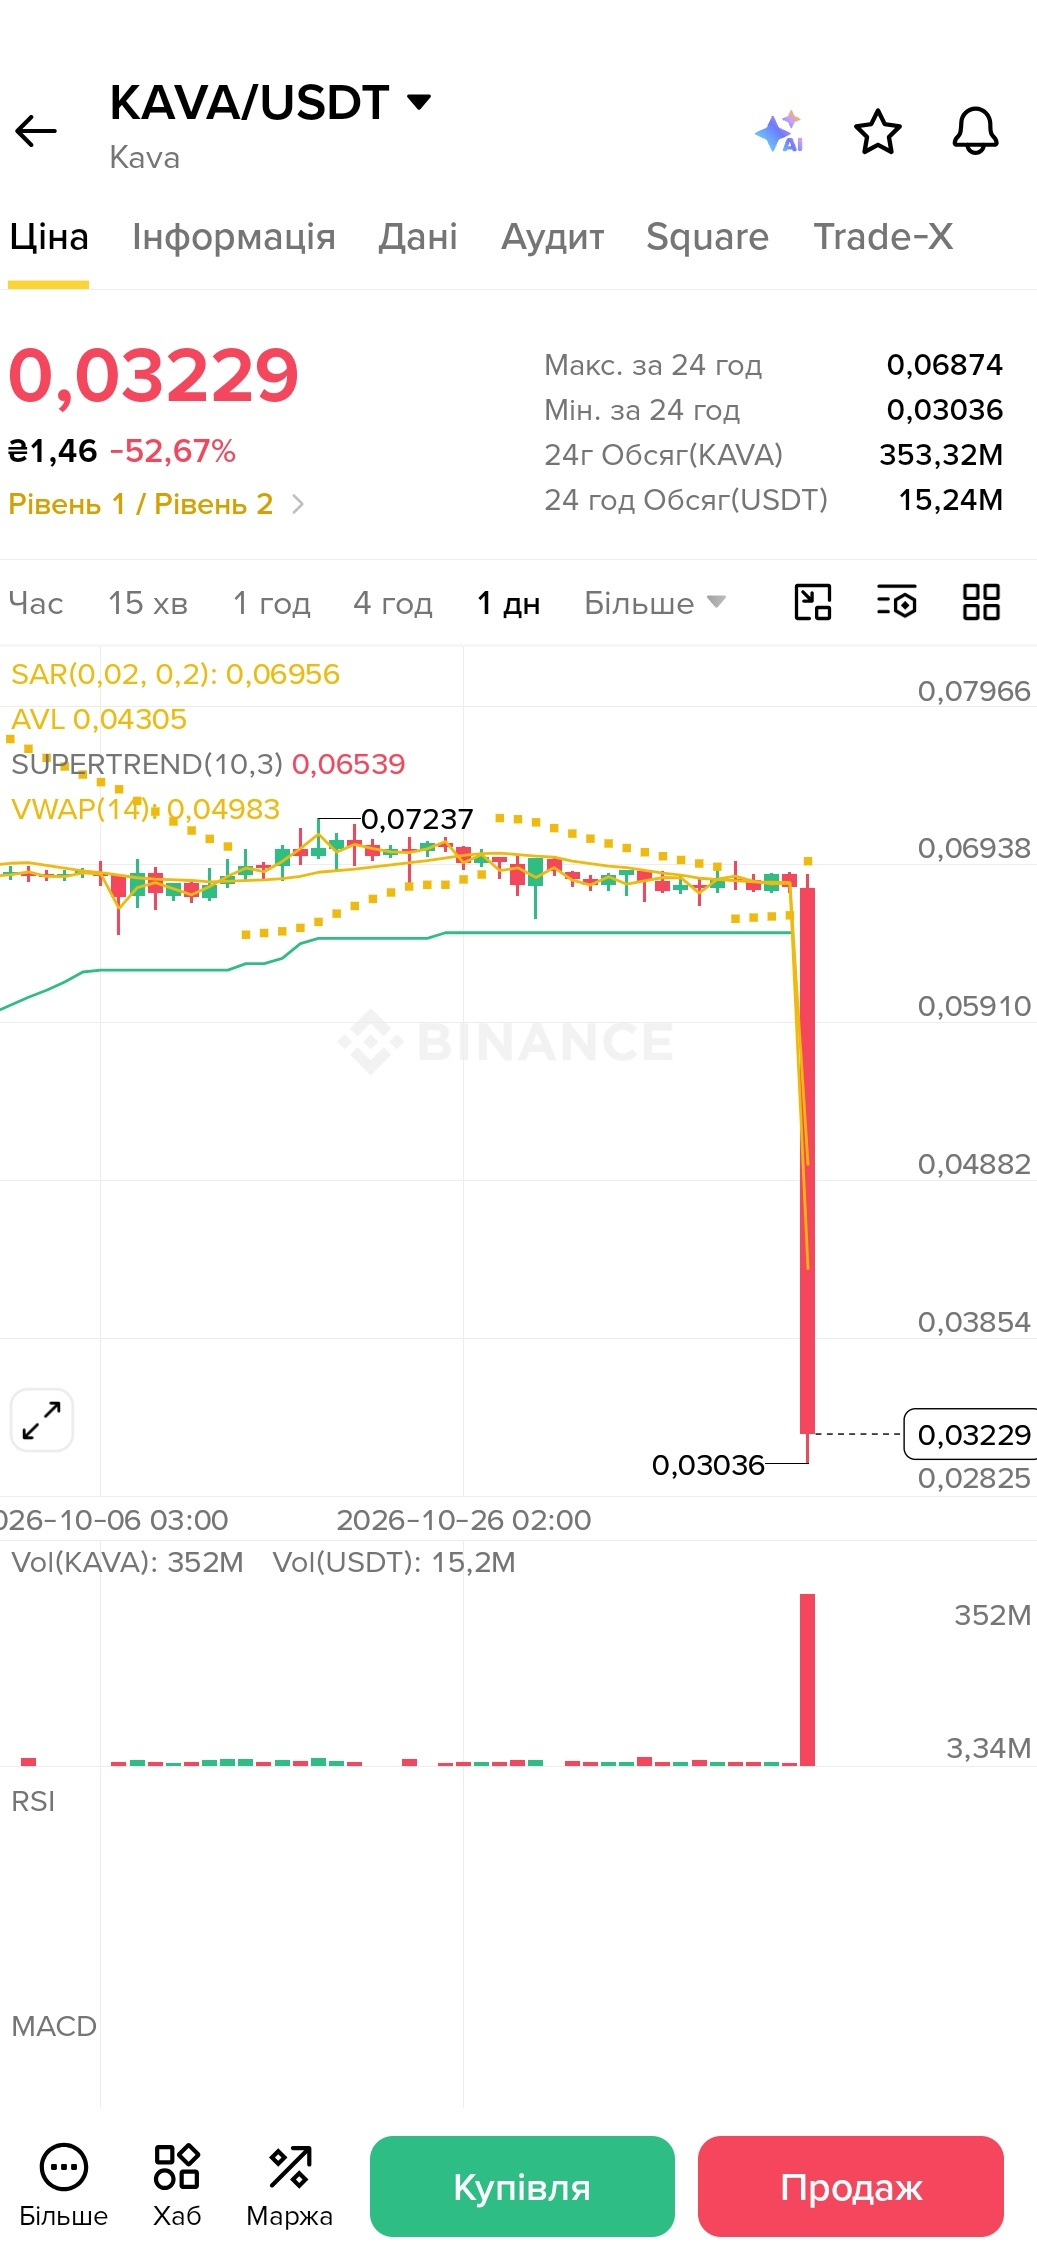
After a prolonged consolidation in the $0.065–$0.072 range, the asset broke through the entire local support structure and printed a powerful red downward candle. Over the past 24 hours, the price plunged from a high of 0.06874 USDT to a new local low of 0.03036 USDT, where the first attempt at stabilization is now underway.
The 24-hour trading volume surged abnormally amid panic selling, reaching 15.24 million USDT (with a volume of 353.32 million KAVA). The current Vol(KAVA) on the candle has hit a record high of 352M (Vol(USDT): 15.2M), confirming massive capitulation and stop-loss triggers.
All key technical indicators remained significantly above the current price and shifted into resistance mode:
The average AVL price is at 0.04305 USDT, serving as the nearest initial reference point in the event of a technical rebound.
The VWAP (14) indicator runs through 0.04983 USDT, the Supertrend (10,3) line switched to a downtrend at 0.06539 USDT, and the Parabolic SAR is at 0.06956 USDT.
⚠️ A crucial warning: drops of more than -50% in a day involve extreme volatility and the risk of further new lows. Absolutely avoid trying to “catch falling knives” without clear confirmation of a reversal, always set stop-losses, and strictly manage your risk!
💬 How do you assess the situation with KAVA? Will the $0.030 zone hold and allow a technical rebound to the AVL level ($0.043), or will selling pressure continue? Share your thoughts in the comments! 👇
#BinanceSquare #KAVA #Layer1 #Layer2 #cryptotrading #TechnicalAnalysis #RiskManagement #altcoins


