📉 NVIDIA (NVDA) – Is the Downtrend Getting Stronger?
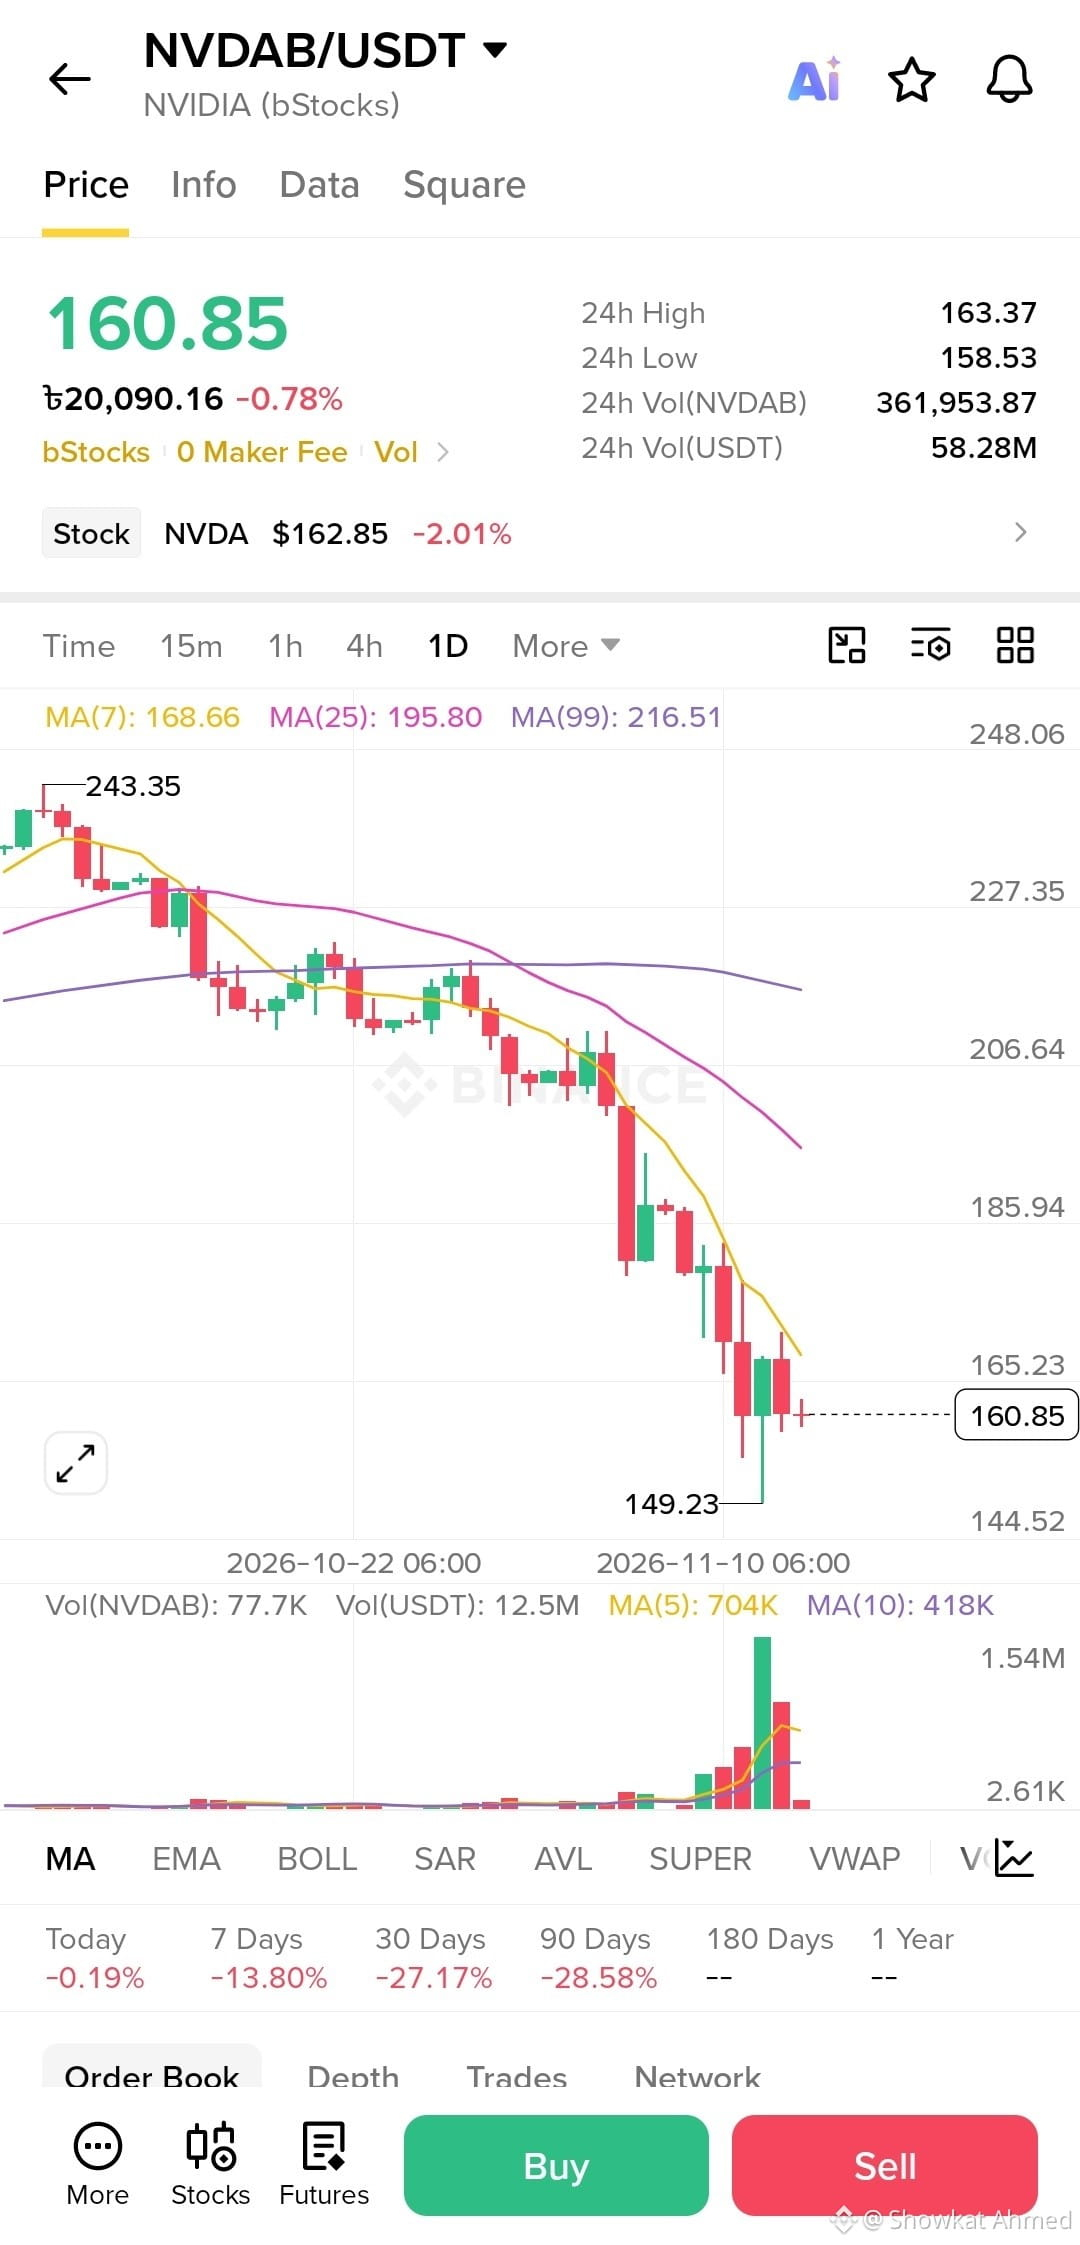
NVIDIA is currently facing significant selling pressure. Let's take a look at the daily chart.
📊 Current Market Overview:
- Current Price: $160.85
- 24H Change: -0.78%
- 7D Performance: -13.80%
- 30D Performance: -27.17%
- 90D Performance: -28.58%
- Recent Low: $149.23
📉 Technical Analysis:
NVDA is trading below all three major moving averages:
- MA(7): $168.66
- MA(25): $195.80
- MA(99): $216.51
This indicates that the overall trend remains bearish.
Key Levels to Watch:
- Support: $149.23
- Resistance: $165.23
- Next Resistance: $185.94
A strong recovery above the short-term moving average could be an early sign of momentum improvement. However, buyers still need to show strength before any trend reversal can be confirmed.
💭 What's Next for NVIDIA?
Will NVDA recover from this correction, or could we see further downside?
Share your thoughts in the comments!
⚠️ This post is for educational purposes only, not financial advice.
# #Crypto #BinanceSquare #Stockmarket #TechnicalAnalysis #trading #MarketAnalysis $NVDAB
NVIDIA is currently facing significant selling pressure. Let's take a look at the daily chart.
📊 Current Market Overview:
- Current Price: $160.85
- 24H Change: -0.78%
- 7D Performance: -13.80%
- 30D Performance: -27.17%
- 90D Performance: -28.58%
- Recent Low: $149.23
📉 Technical Analysis:
NVDA is trading below all three major moving averages:
- MA(7): $168.66
- MA(25): $195.80
- MA(99): $216.51
This indicates that the overall trend remains bearish.
Key Levels to Watch:
- Support: $149.23
- Resistance: $165.23
- Next Resistance: $185.94
A strong recovery above the short-term moving average could be an early sign of momentum improvement. However, buyers still need to show strength before any trend reversal can be confirmed.
💭 What's Next for NVIDIA?
Will NVDA recover from this correction, or could we see further downside?
Share your thoughts in the comments!
⚠️ This post is for educational purposes only, not financial advice.
# #Crypto #BinanceSquare #Stockmarket #TechnicalAnalysis #trading #MarketAnalysis $NVDAB