🚨 WILL $XRP BOUNCE OR BREAK THE PSYCHOLOGICAL SUPPORT AT $1.00? 📉👀
Analyzing the daily chart (1D) of $XRP /USDT (Perp) in real time:
📊 1. Price Action and Trend:
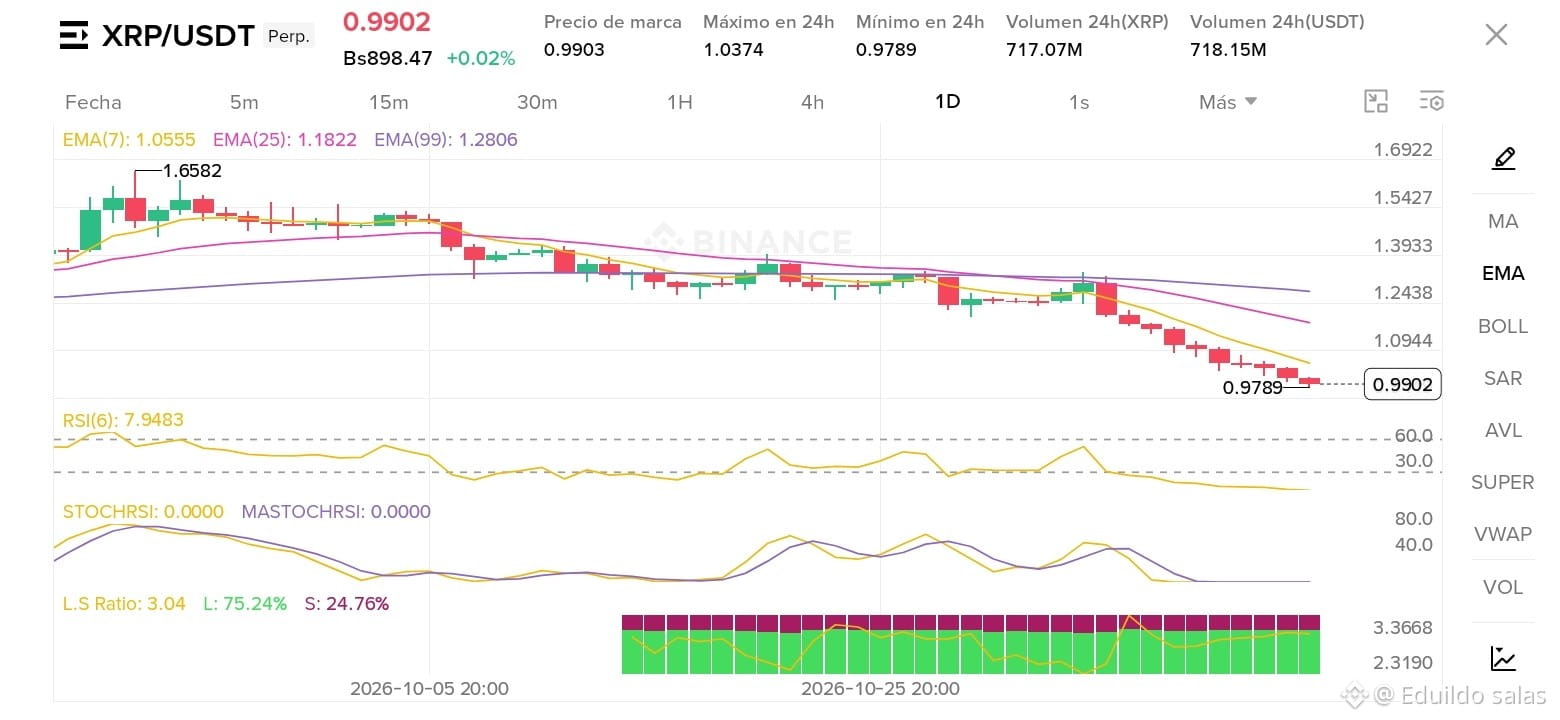
Current price: $0.9902 (+0.02%) after hitting a 24-hour low of $0.9789.
Structure: We've seen a sharp pullback from the high of $1.6582. The price is trading clearly below the key moving averages (EMA 7 at $1.0555, EMA 25 at $1.1822, and EMA 99 at $1.2806), confirming short- to medium-term bearish dominance.
🔥 2. Extremely Oversold Indicators:
RSI(6): At 7.9483 (critically oversold).
STOCHRSI / MASTOCHRSI: Both at rock bottom at 0.0000.
Reading: Seller exhaustion is evident. Technically, the market is calling for a breather or a relief bounce toward the EMA(7) (~$1.05).
⚠️ 3. The Key Futures Data (Be very careful!):
L.S Ratio (Long/Short): 3.04 — 75.24% of the market is positioned Long, compared to just 24.76% Short.
Reading: Too much bullish leverage is trying to "catch the bottom." If strong buying volume doesn't come in to defend $0.9789, we could see a liquidity sweep (long liquidations) before the real bounce.
🎯 Levels to watch:
Immediate support: $0.9789
Key resistance: $1.0374 (24-hour high) and $1.0555 (EMA 7)
💬 What are you doing at this level? Buying the fear and looking for a bounce, or waiting for confirmation above $1.05? Let me know in the comments! 👇
#XRPUSDT #WhatWillDriveCryptoandStocks’NextRebound? #BitcoinActiveSupplyInProfitDropsBelow45%
Analyzing the daily chart (1D) of $XRP /USDT (Perp) in real time:
📊 1. Price Action and Trend:
Current price: $0.9902 (+0.02%) after hitting a 24-hour low of $0.9789.
Structure: We've seen a sharp pullback from the high of $1.6582. The price is trading clearly below the key moving averages (EMA 7 at $1.0555, EMA 25 at $1.1822, and EMA 99 at $1.2806), confirming short- to medium-term bearish dominance.
🔥 2. Extremely Oversold Indicators:
RSI(6): At 7.9483 (critically oversold).
STOCHRSI / MASTOCHRSI: Both at rock bottom at 0.0000.
Reading: Seller exhaustion is evident. Technically, the market is calling for a breather or a relief bounce toward the EMA(7) (~$1.05).
⚠️ 3. The Key Futures Data (Be very careful!):
L.S Ratio (Long/Short): 3.04 — 75.24% of the market is positioned Long, compared to just 24.76% Short.
Reading: Too much bullish leverage is trying to "catch the bottom." If strong buying volume doesn't come in to defend $0.9789, we could see a liquidity sweep (long liquidations) before the real bounce.
🎯 Levels to watch:
Immediate support: $0.9789
Key resistance: $1.0374 (24-hour high) and $1.0555 (EMA 7)
💬 What are you doing at this level? Buying the fear and looking for a bounce, or waiting for confirmation above $1.05? Let me know in the comments! 👇
#XRPUSDT #WhatWillDriveCryptoandStocks’NextRebound? #BitcoinActiveSupplyInProfitDropsBelow45%