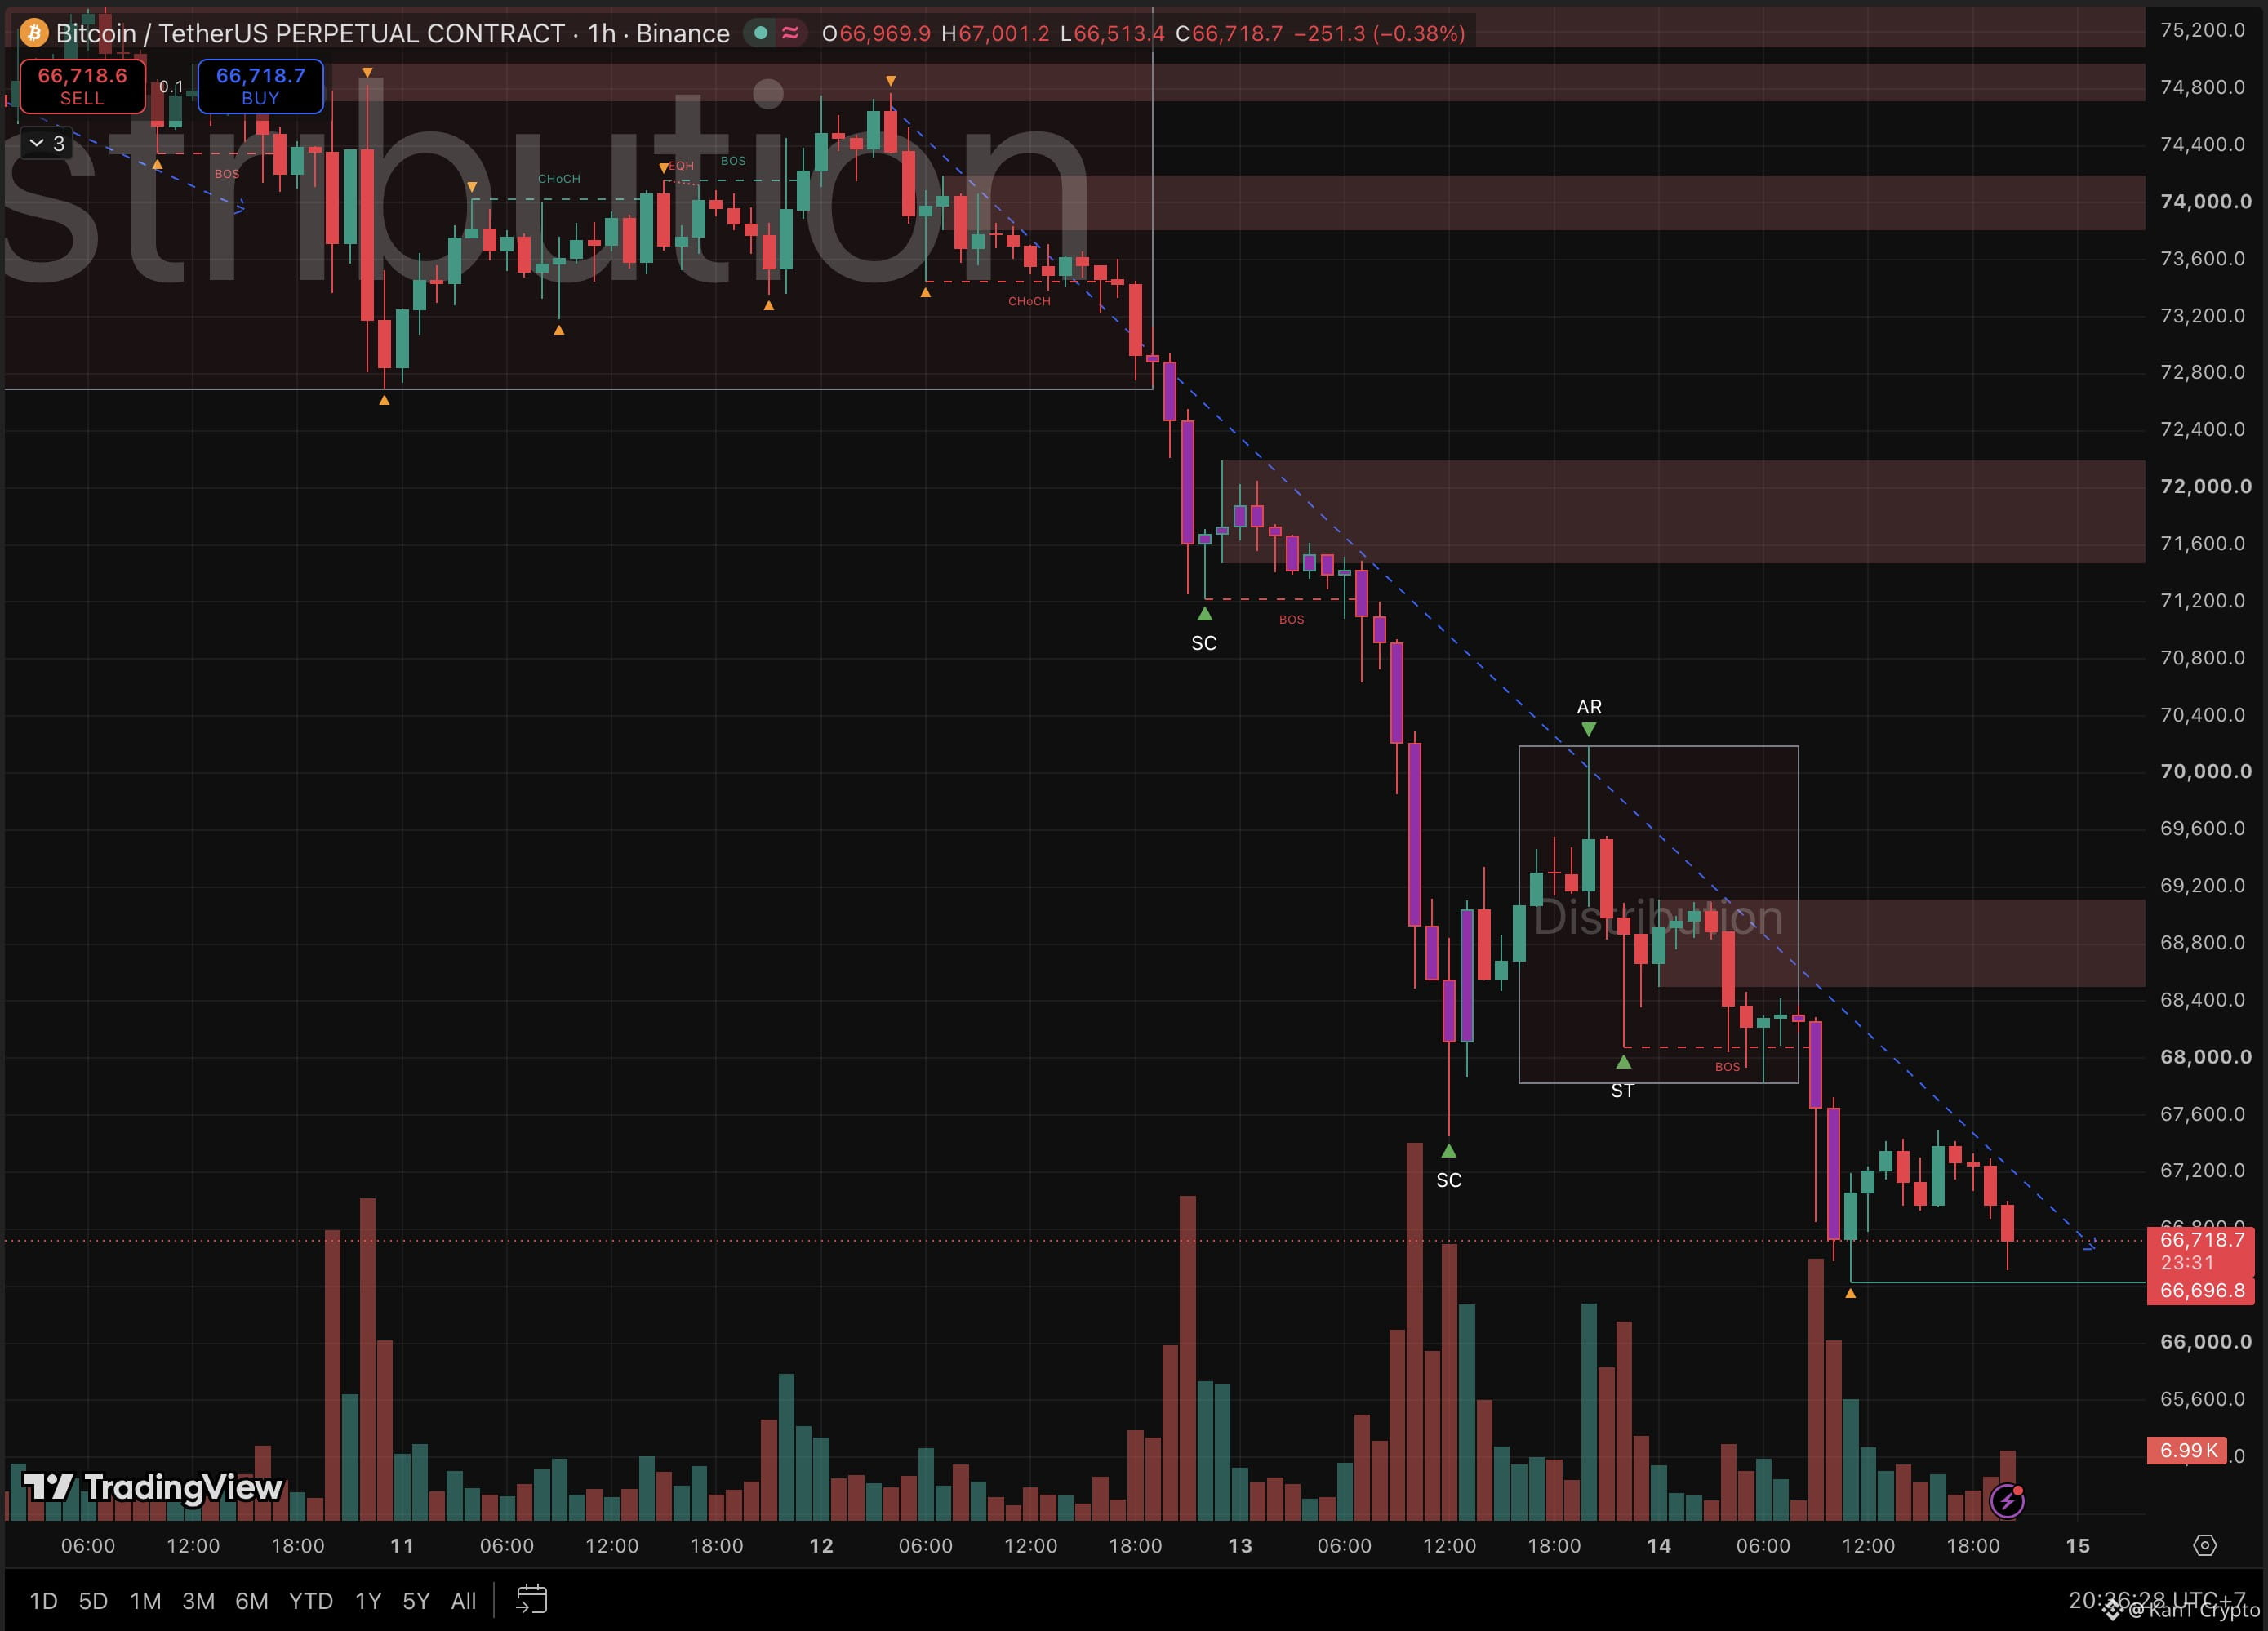
📉 The 200-week average was supposed to be Bitcoin's floor. Bitcoin is now trading under it.
200W MA: ~$68K (the average price of the last four years)
Now: $66,718, about 2% below it
Weekend low: ~$66.4K
Last 30 days: down 16%+
This morning's map: lose $67.45K and the flush resumes.
It lost it before lunch.
Look at what the chart did to every bounce.
Friday's pop to $70.2K died on the descending trendline from Thursday.
Today's bounce to $67.45K died on the exact same line.
Lower high. Lower low. Repeat.
Friday's bounce range didn't become a base either.
Once the $68.06K test broke, it read as more distribution (sellers unloading into a flat range), and the supply at $68.4K to $69.2K now sits on top of the 200W.
Bulls still have two straws.
Funding just flipped negative, so shorts are now paying longs. Crowded shorts can fuel sharp squeezes, though it guarantees nothing.
And the daily RSI sits near 28, deep in oversold. 👀
But one candle matters more than all of this: Sunday's weekly close (UTC).
Close the week back above $68K → the break was a fakeout, $69.2K is next.
Weekly close below $68K → the 200W flips to resistance, and below $66.4K nothing major is marked until the $57.7K cycle low.
Oversold can stay oversold. Don't fight a trendline that has rejected every bounce for three days.
Shakeout under the 200W, or the road back to $57.7K?
Not financial advice.
$BTC
$ETH
$SOL
200W MA: ~$68K (the average price of the last four years)
Now: $66,718, about 2% below it
Weekend low: ~$66.4K
Last 30 days: down 16%+
This morning's map: lose $67.45K and the flush resumes.
It lost it before lunch.
Look at what the chart did to every bounce.
Friday's pop to $70.2K died on the descending trendline from Thursday.
Today's bounce to $67.45K died on the exact same line.
Lower high. Lower low. Repeat.
Friday's bounce range didn't become a base either.
Once the $68.06K test broke, it read as more distribution (sellers unloading into a flat range), and the supply at $68.4K to $69.2K now sits on top of the 200W.
Bulls still have two straws.
Funding just flipped negative, so shorts are now paying longs. Crowded shorts can fuel sharp squeezes, though it guarantees nothing.
And the daily RSI sits near 28, deep in oversold. 👀
But one candle matters more than all of this: Sunday's weekly close (UTC).
Close the week back above $68K → the break was a fakeout, $69.2K is next.
Weekly close below $68K → the 200W flips to resistance, and below $66.4K nothing major is marked until the $57.7K cycle low.
Oversold can stay oversold. Don't fight a trendline that has rejected every bounce for three days.
Shakeout under the 200W, or the road back to $57.7K?
Not financial advice.
$BTC
$ETH
$SOL