


Data as of November 14, 2026, 06:00 UTC. Prices change in real time and are for reference only; this is not investment advice. This article contains bold projections—please make your own judgment.
I. What is happening in the market: two bubbles bursting at once
On this night in November 2026, capital markets are bursting two bubbles at the same time.
First, let's take a clear look at the latest data snapshot (November 14, 06:00 UTC):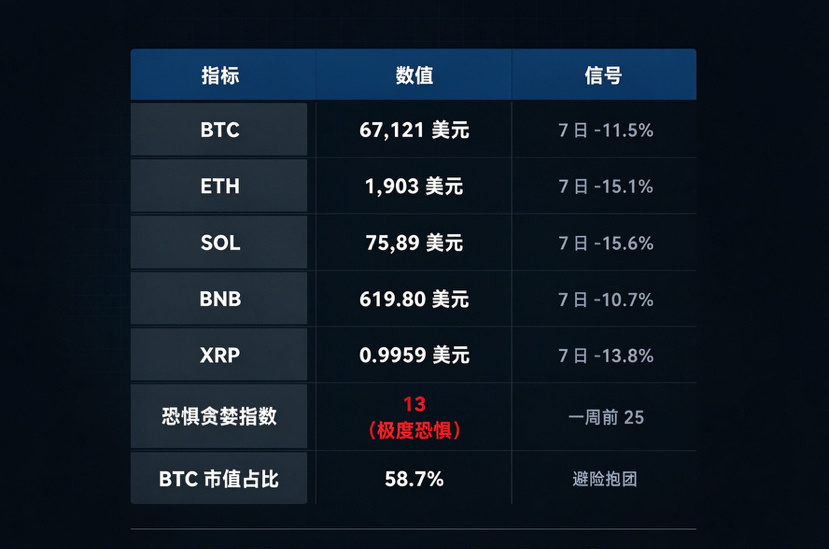
This is a broad-based sell-off across all asset classes, and the Fear & Greed Index has plunged from 25 a week ago to 13—the mood is deteriorating even faster than prices are falling.
The real trigger is the bursting of the AI bubble.
On November 5, 2026, the Nasdaq Composite plunged 5.52%, the Nasdaq 100 sank 6.4%—its biggest single-day drop since March 2020—while the S&P 500 fell 4.36% and the Dow dropped 1,833 points. The market lost $2.5 trillion in value in a single day, and the “Magnificent Seven” lost about $1 trillion combined
The trigger came from the US midterm elections. After Democrats retook majorities in both the House and Senate, markets began seriously pricing in expectations of tighter AI regulation: several election winners advocated pausing data center development and advanced AI research, and in September 2026 even proposed the (2026 Ban on Artificial Superintelligence Act). Nvidia fell 9.26% that day, AMD dropped 17%, and Tesla fell 10.77%.
Why does an AI crash spill over into BTC? Because crypto has been repriced as a “macro risk asset.” Wall Street veteran Fred Krueger summed it up best: Bitcoin bear markets have only two causes—global liquidity turning negative, or crypto-specific forced selling. Everything else is noise.
The AI crash is transmitted through three channels: collapsing risk appetite → tightening dollar liquidity → crypto being sold off along with “high-beta tech stocks.”
II. Bearish factors: seven pressures pile up
Break down all the current bearish factors, and you’ll understand why sentiment has fallen to 13.
1. The Fed: from rate-cut expectations to rate hikes
October CPI rose 0.4% month over month (above the expected 0.3%), while core CPI rose 0.3% (above the expected 0.2%); October nonfarm payrolls increased by 165,000, far above expectations, and the unemployment rate fell to 4.1%. The market’s focus has shifted from “Will rates be cut?” to “Will rates rise by 25 or 50 basis points in December?”
Interest rates are the discount rate for BTC, a non-yielding asset. When the denominator rises, the price must be repriced.
2. Ongoing ETF outflows—the most direct source of selling pressure
On November 13, US spot Bitcoin ETFs saw net outflows of$185.45 million, marking theirseventh consecutive trading dayof net outflows
That day, IBIT saw outflows of $143.53 million, while FBTC saw outflows of $41.92 million
On a trading day shortly before, combined net outflows from spot BTC and ETH ETFs exceeded $500 million, with BlackRock’s IBIT seeing single-day outflows of about $400 million
Net assets under management in spot BTC ETFs fell to $86.2 billion, about 6.22% of BTC’s market cap
This is the most dangerous signal: ETFs are the main channel for institutional capital in this bull market. Once that channel reverses, it becomes a source of sustained selling pressure.
3. Spillover of sentiment from the macro sell-off
The bursting of the AI bubble has prompted a repricing of global risk assets. BTC is now significantly more correlated with the Nasdaq, and “tech stocks fall → crypto falls” has become a fixed chain of transmission.
4. Rumors that Nvidia CEO Jensen Huang is resigning
This triggered a synchronized decline in tech stocks and the AI sector, with crypto, as a “technology risk asset,” hit by the spillover in sentiment.
5. MSCI removes Strategy from its US indexes
MSCI excluded “Bitcoin treasury companies” such as Strategy, deeming them to have fund-like characteristics. This directly undermines the legitimacy of the corporate treasury model used by “BTC version of Strategy” companies—one of the most central structural narratives of this bull market.
6. Deleveraging
Over 24 hours, 151,000 traders were liquidated, totaling $1.232 billion. The chain reaction of leveraged position closures is the key mechanism accelerating the decline.
7. Self-reinforcing extreme fear
A Fear and Greed Index reading of 13 is in the extreme sentiment zone. Once the feedback loop of panic → selling → more panic takes hold, it can become detached from fundamentals.
III. A historical review: the two bloodbaths of 2017–2018 and 2021–2022
To predict how far this downturn could go, first take a clear look at history. Peak-to-trough declines in the four major bear markets:
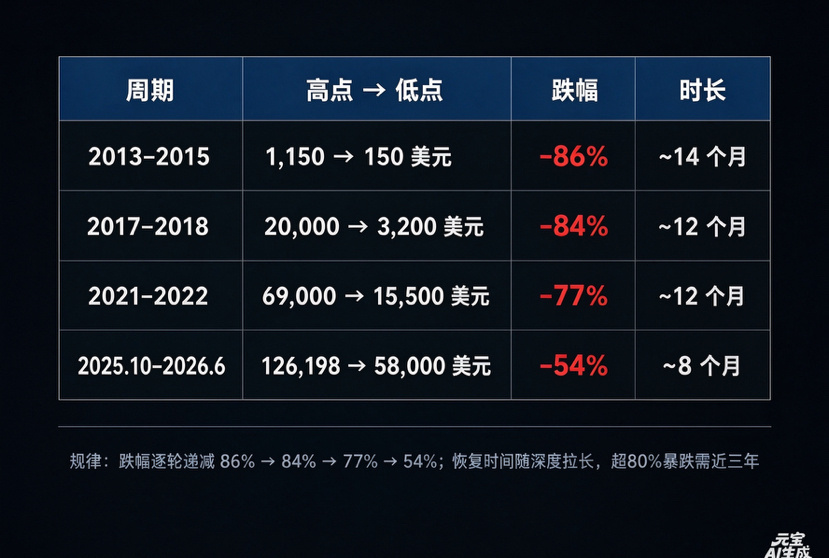
Key pattern (from BlackRock’s own analysis):
Since 2014, BTC’s three largest drawdowns have averaged about 80%, and it took nearly three years to fully recover from each one
Each bear market has seen a slightly smaller decline than the previous one: 86% → 84% → 77%
The depth of the correction determines the pace of recovery:A 40–50% decline takes 9–14 months to recover from; a crash of over 80% takes three years or even longer
IV. A bold projection: could this downturn reach 80–90%?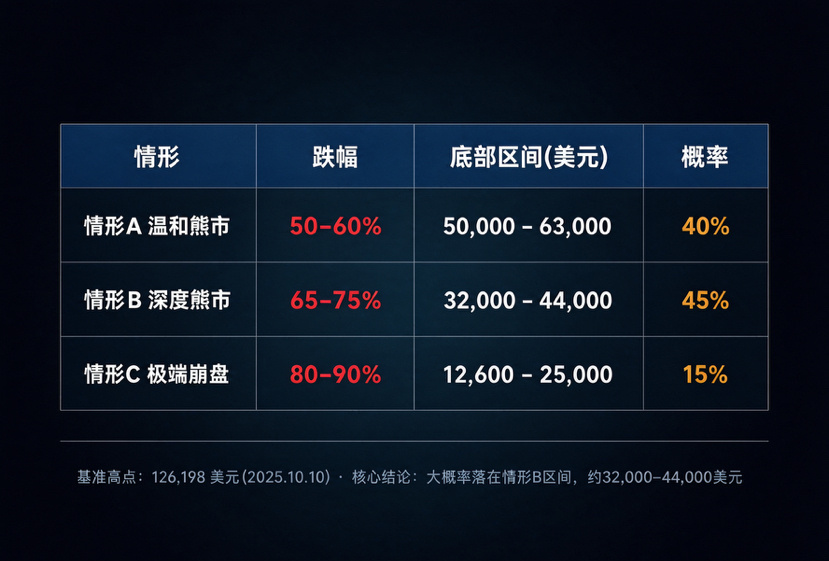
This is the central question of this article. I’ll give you scenario-based projections, rather than a number pulled out of thin air.
This cycle’s peak: $126,198 (October 2025)
Scenario A: Mild bear market (about 40% probability)—a 50–60% decline
Bottom range: approximately $50,000–$63,000
Rationale: deeper institutional adoption, an existing ETF channel, and the trend of declining drawdowns continuing
Implied depth: close to the low already reached in June 2026 (when it had fallen 28.84% to $90,015)
Scenario B: Deep bear market (about 45% probability)—a 65–75% declineBottom range: approximately $32,000–$44,000
Rationale: AI bubble bursting + Fed rate hikes + sustained ETF outflows + cascading liquidations of leveraged positions
This is the most likely scenario in my view
Scenario C: Extreme crash (about 15% probability)—an 80–90% decline
Bottom range: approximately $12,600–$25,000
Rationale: would require an 2018-style “liquidity drought + crypto-specific black swan” (such as a series of exchange/institution collapses on the scale of FTX)
An 2018-style 84% decline would imply about $20,000; a 90% decline would imply about $12,600
My view: this downturn will most likely fall in the 65–75% range, or $32,000–$44,000
There are three reasons:
First, an 80–90% decline would require a “double blow” to materialize. Historically, every crash of over 80% has involved both a tightening of global liquidity and forced selling within the crypto industry (Mt. Gox, Terra/Luna, 3AC, Celsius, FTX). So far, only the first condition is present in this cycle; the second has yet to occur.
Second, the pattern of declining drawdowns has not yet been broken. From 86% → 84% → 77%, a sudden jump to 90% in the next cycle would require a systemic event more severe than FTX.
Third, this cycle has a variable that wasn’t present in 2018—the AI bubble. This is the risk most easily underestimated. If the AI bubble bursts and triggers a full-fledged bear market similar to the dot-com bubble in 2000 (when the Nasdaq fell from 5,000 to 1,100, a decline of about 78%), then crypto, as a “high-beta technology risk asset,” could certainly be dragged down to a 75% drawdown or even deeper.
Bottom-line projection: from this cycle’s peak of $126,198, BTC’s theoretical bottom is most likely $32,000–$44,000 (a 65–75% decline), with a small chance of $20,000–$25,000 (an 80–90% decline); it is almost impossible for it to fall below $12,600.
BTC is currently at $67,121, which means that even under mild Scenario A, there is still about 20–30% downside; under core Scenario B, there is still about 40–55% downside.
V. Projections by asset: BTC and ETH may fall together, but face different fates
BTC (58.7% market cap dominance): Its high share reflects a “flight to safety,” making it relatively resilient. But if panic spreads, BTC will become the last asset investors sell for cash—institutions will prioritize selling the most liquid assets.
ETH (10.1% market cap dominance): The weakest performer in this cycle. It fell 15.1% over seven days, significantly more than BTC’s 11.5%. It faces three challenges:
The “ultrasound money” narrative has fallen apart—in 2026, ETH is actually experiencing mild inflation (+0.2–0.3% annualized), not deflation
L2 growth, but token holders don’t benefit—After Dencun/Pectra/Fusaka, transactions migrated to L2s, sharply reducing burn volumes, while validator issuance remained relatively steady
Ongoing ETF outflows—Year to date, ETH-related ETFs are down 33.5%, significantly underperforming IBIT’s 21.6% decline
If ETH’s decline is 1.3–1.5 times BTC’s, its drawdown could reach 80–85%.
SOL / XRP / BNB: Their seven-day declines reached 15.6% / 13.8% / 10.7%, respectively, with major altcoins generally falling more than BTC. When BTC.D peaks and retreats, altcoins will rebound faster; if BTC.D continues to rise, altcoins will keep bleeding.
VI. Three signals you must watch
BTC’s 24-hour low is $66,492—a close below this level would confirm that the seven-day decline of 11.5% is continuing; a break below the June low near $58,000 would trigger deep bear market Scenario B
The Fed’s December 8–9 rate decision meeting—this is the key factor determining the medium-term direction. If a rate hike is implemented, markets will face a second shock from repricing
Whether spot BTC ETF flows stop falling—seven consecutive days of net outflows is already an ominous sign; a sustained shift to net inflows may be needed for a bottom to form
VII. Conclusion
This cycle is more likely to see a “deep correction” of 65–75%, rather than an 84% decline like in 2018, with a bottom at $32,000–$44,000. But if the AI bubble turns into a dot-com-style crash like in 2000, compounded by another FTX-level black swan within the crypto industry, a decline of 80–90% (about $12,600–$25,000) cannot be ruled out entirely.
The Fear and Greed Index at 13, seven consecutive days of ETF outflows, and the bursting of the AI bubble are converging—a reason not to buy the dip, but a signal to respect the risks.
Historically, every 80% crash has taken nearly three years to recover from. If you’re buying the dip at $67,121, think carefully: are you ready to hold for three years?
