Bitcoin: Profit/Loss Supply Ratio (excluding >7Y)
The balance of active supply has tipped toward losses.
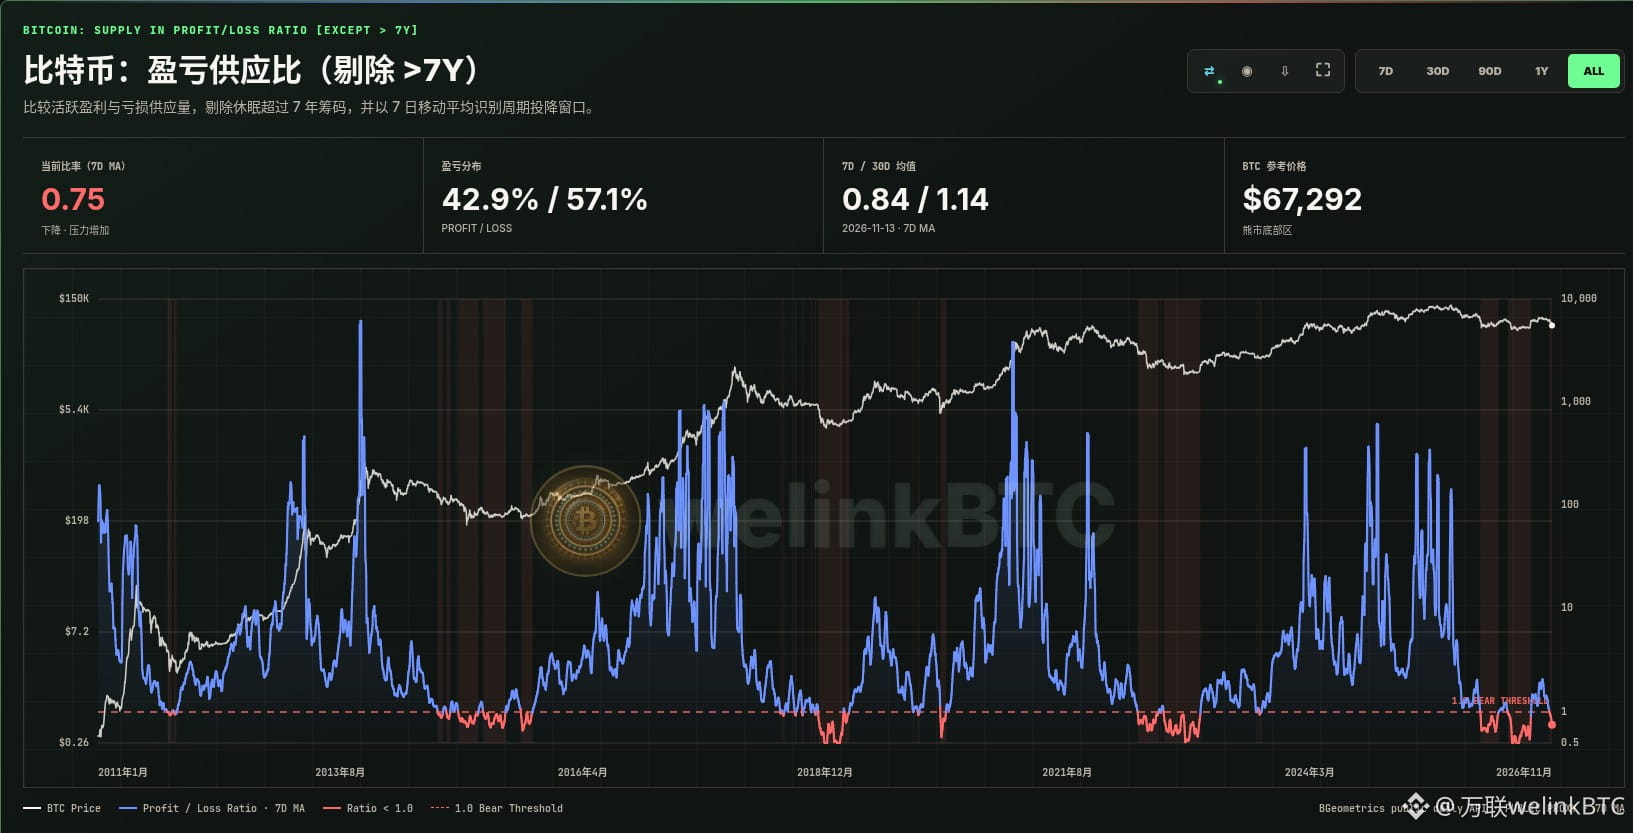
After excluding coins dormant for more than 7 years, Bitcoin’s profit/loss supply ratio (7-day moving average) fell to 0.75, with about 42.9% of active supply in profit and 57.1% at a loss. The 7-day average is 0.84, and the 30-day average is 1.14. The ratio is now 0.25 below the 1.0 threshold and has remained below 1.0 for 11 consecutive days (on-chain date: 2026-11-13). The 7-day trend is still declining, and pressure continues to build.
How should you read this metric? It divides the total supply in profit, excluding coins dormant for more than 7 years, by the total supply in loss, then takes the 7-day moving average. A ratio above 1.0 means more active coins are in profit; below 1.0 means coins at a loss dominate, corresponding to widespread unrealized losses and periods of capitulation.
Historically, the ratio stayed below 1.0 for about 280 days in 2014–2015, about 160 days in 2018–2019, and about 190 days in 2022–2023. Each period overlapped with the bottoming phase of a deep bear market. The current period has lasted just 11 days so far.
Note that a single dip below 1.0 does not confirm an absolute bottom. What’s more useful to track is how long the ratio stays below the threshold, how its slope changes, and whether spot demand and liquidity can keep up. A move back above 1.0, accompanied by a sustained rise in the 7-day average, is usually more informative than a brief touch of the threshold.
More curated on-chain cycle indicators
Portal: https://welinkbtc-onchainmain.xyz/
Understand market cycles like a professional analyst
$BTC
The balance of active supply has tipped toward losses.
After excluding coins dormant for more than 7 years, Bitcoin’s profit/loss supply ratio (7-day moving average) fell to 0.75, with about 42.9% of active supply in profit and 57.1% at a loss. The 7-day average is 0.84, and the 30-day average is 1.14. The ratio is now 0.25 below the 1.0 threshold and has remained below 1.0 for 11 consecutive days (on-chain date: 2026-11-13). The 7-day trend is still declining, and pressure continues to build.
How should you read this metric? It divides the total supply in profit, excluding coins dormant for more than 7 years, by the total supply in loss, then takes the 7-day moving average. A ratio above 1.0 means more active coins are in profit; below 1.0 means coins at a loss dominate, corresponding to widespread unrealized losses and periods of capitulation.
Historically, the ratio stayed below 1.0 for about 280 days in 2014–2015, about 160 days in 2018–2019, and about 190 days in 2022–2023. Each period overlapped with the bottoming phase of a deep bear market. The current period has lasted just 11 days so far.
Note that a single dip below 1.0 does not confirm an absolute bottom. What’s more useful to track is how long the ratio stays below the threshold, how its slope changes, and whether spot demand and liquidity can keep up. A move back above 1.0, accompanied by a sustained rise in the 7-day average, is usually more informative than a brief touch of the threshold.
More curated on-chain cycle indicators
Portal: https://welinkbtc-onchainmain.xyz/
Understand market cycles like a professional analyst
$BTC