$BTC 67.196 · $ETH 1.900: the weekly trend is tilted downward—who has the advantage, and at what levels does it end?
📉 Weekly trend: TILTED DOWNWARD. Since 2019, there have been 228 days like this; BTC was lower one week later 58% of the time (ETH follows BTC: lower 58% of the time). This signal is weaker than usual.
🧭 The trend-following trade is SHORT: BTC was lower one week later 58% of the time, while the long side was right only 42% of the time. Going long now means trading against the trend. The difference is not large, so the advantage is slim.
🟠 BTC · 67.196 · +0,2% over the past 4 hours
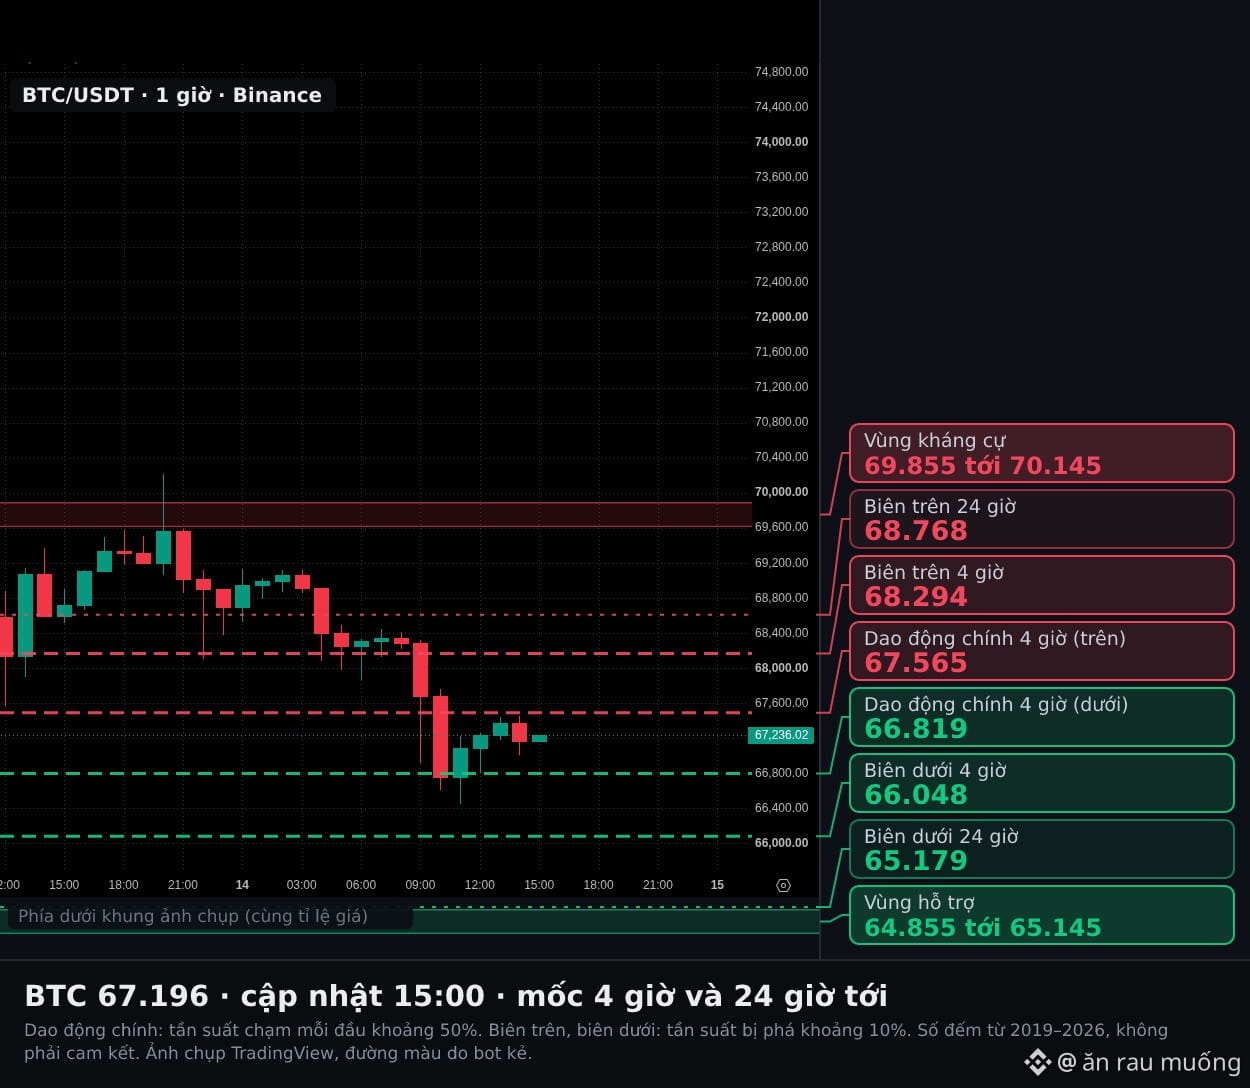
🧱 Over the next 7 days, the lower levels are more likely to be touched than the upper ones, in line with the weekly trend: support at 64.855 to 65.145 has a 63% chance of being touched and a 41% chance of being decisively broken; resistance at 69.855 to 70.145 has a 44% chance of being touched and a 23% chance of being decisively broken.
👉 As long as BTC remains below the resistance zone of 69.855 to 70.145, sellers retain the advantage.
📍 4-hour timeframe (through 19:00): main trading range 66.819 to 67.565; upper bound 68.294, lower bound 66.048.
📆 24-hour timeframe: main trading range 66.523 to 67.754; upper bound 68.768, lower bound 65.179.
🔷 ETH · 1.900 · 0,0% over the past 4 hours
🧱 Over the next 7 days, the lower levels are more likely to be touched than the upper ones, in line with the weekly trend: support at 1.794 to 1.806 has a 57% chance of being touched and a 37% chance of being decisively broken; resistance at 1.994 to 2.027 has a 44% chance of being touched and a 23% chance of being decisively broken.
👉 As long as ETH remains below the resistance zone of 1.994 to 2.027, sellers retain the advantage.
📍 4-hour timeframe (through 19:00): main trading range 1.885 to 1.915; upper bound 1.945, lower bound 1.852.
📆 24-hour timeframe: main trading range 1.873 to 1.926; upper bound 1.973, lower bound 1.812.
🌐 News currently affecting prices:
• Negative news, high impact: U.S. stocks fell as Nvidia shares came under heavier selling pressure and U.S. inflation reached its highest level in four years (14/11).
• Negative news, moderate impact: U.S. Bitcoin ETFs saw net outflows of 1.07 billion USD in one week, bringing the two-week total to 2.35 billion USD (14/11).
Levels and percentages are based on historical market statistics from 2019 to 2026: the main trading range has about a 50% chance of each end being touched, while the upper and lower bounds have about a 10% chance of being broken. This is not investment advice. Manage your capital before entering a trade.
#BTC #ETH
📉 Weekly trend: TILTED DOWNWARD. Since 2019, there have been 228 days like this; BTC was lower one week later 58% of the time (ETH follows BTC: lower 58% of the time). This signal is weaker than usual.
🧭 The trend-following trade is SHORT: BTC was lower one week later 58% of the time, while the long side was right only 42% of the time. Going long now means trading against the trend. The difference is not large, so the advantage is slim.
🟠 BTC · 67.196 · +0,2% over the past 4 hours
🧱 Over the next 7 days, the lower levels are more likely to be touched than the upper ones, in line with the weekly trend: support at 64.855 to 65.145 has a 63% chance of being touched and a 41% chance of being decisively broken; resistance at 69.855 to 70.145 has a 44% chance of being touched and a 23% chance of being decisively broken.
👉 As long as BTC remains below the resistance zone of 69.855 to 70.145, sellers retain the advantage.
📍 4-hour timeframe (through 19:00): main trading range 66.819 to 67.565; upper bound 68.294, lower bound 66.048.
📆 24-hour timeframe: main trading range 66.523 to 67.754; upper bound 68.768, lower bound 65.179.
🔷 ETH · 1.900 · 0,0% over the past 4 hours
🧱 Over the next 7 days, the lower levels are more likely to be touched than the upper ones, in line with the weekly trend: support at 1.794 to 1.806 has a 57% chance of being touched and a 37% chance of being decisively broken; resistance at 1.994 to 2.027 has a 44% chance of being touched and a 23% chance of being decisively broken.
👉 As long as ETH remains below the resistance zone of 1.994 to 2.027, sellers retain the advantage.
📍 4-hour timeframe (through 19:00): main trading range 1.885 to 1.915; upper bound 1.945, lower bound 1.852.
📆 24-hour timeframe: main trading range 1.873 to 1.926; upper bound 1.973, lower bound 1.812.
🌐 News currently affecting prices:
• Negative news, high impact: U.S. stocks fell as Nvidia shares came under heavier selling pressure and U.S. inflation reached its highest level in four years (14/11).
• Negative news, moderate impact: U.S. Bitcoin ETFs saw net outflows of 1.07 billion USD in one week, bringing the two-week total to 2.35 billion USD (14/11).
Levels and percentages are based on historical market statistics from 2019 to 2026: the main trading range has about a 50% chance of each end being touched, while the upper and lower bounds have about a 10% chance of being broken. This is not investment advice. Manage your capital before entering a trade.
#BTC #ETH