$ETH Same set of parameters, four timeframes, the same ETH—will they produce signals that confirm one another?
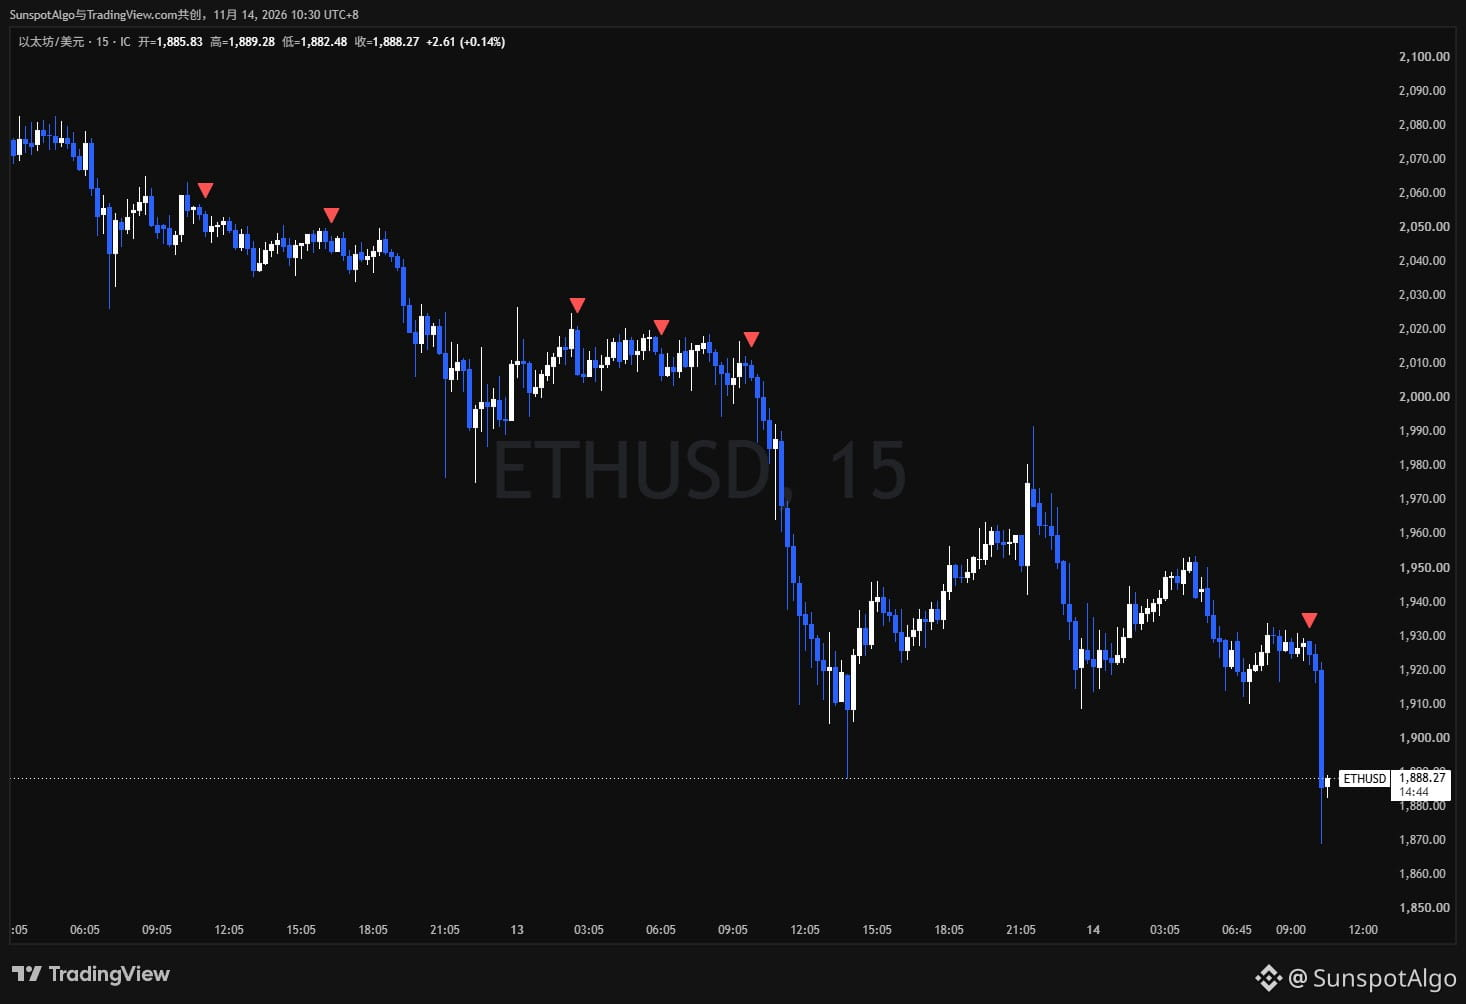
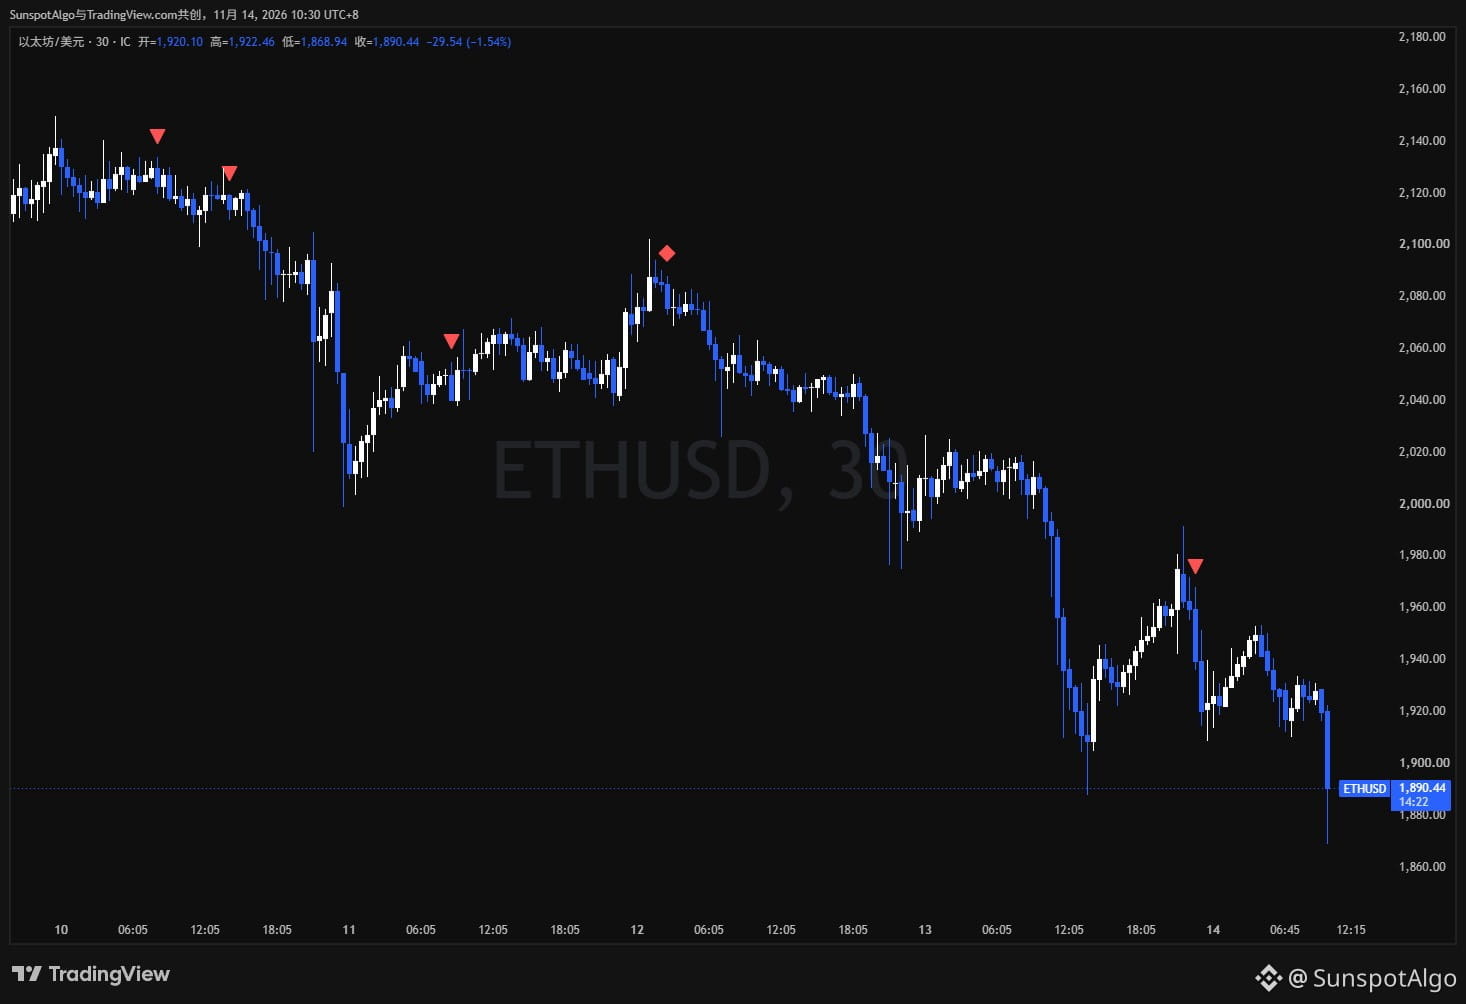
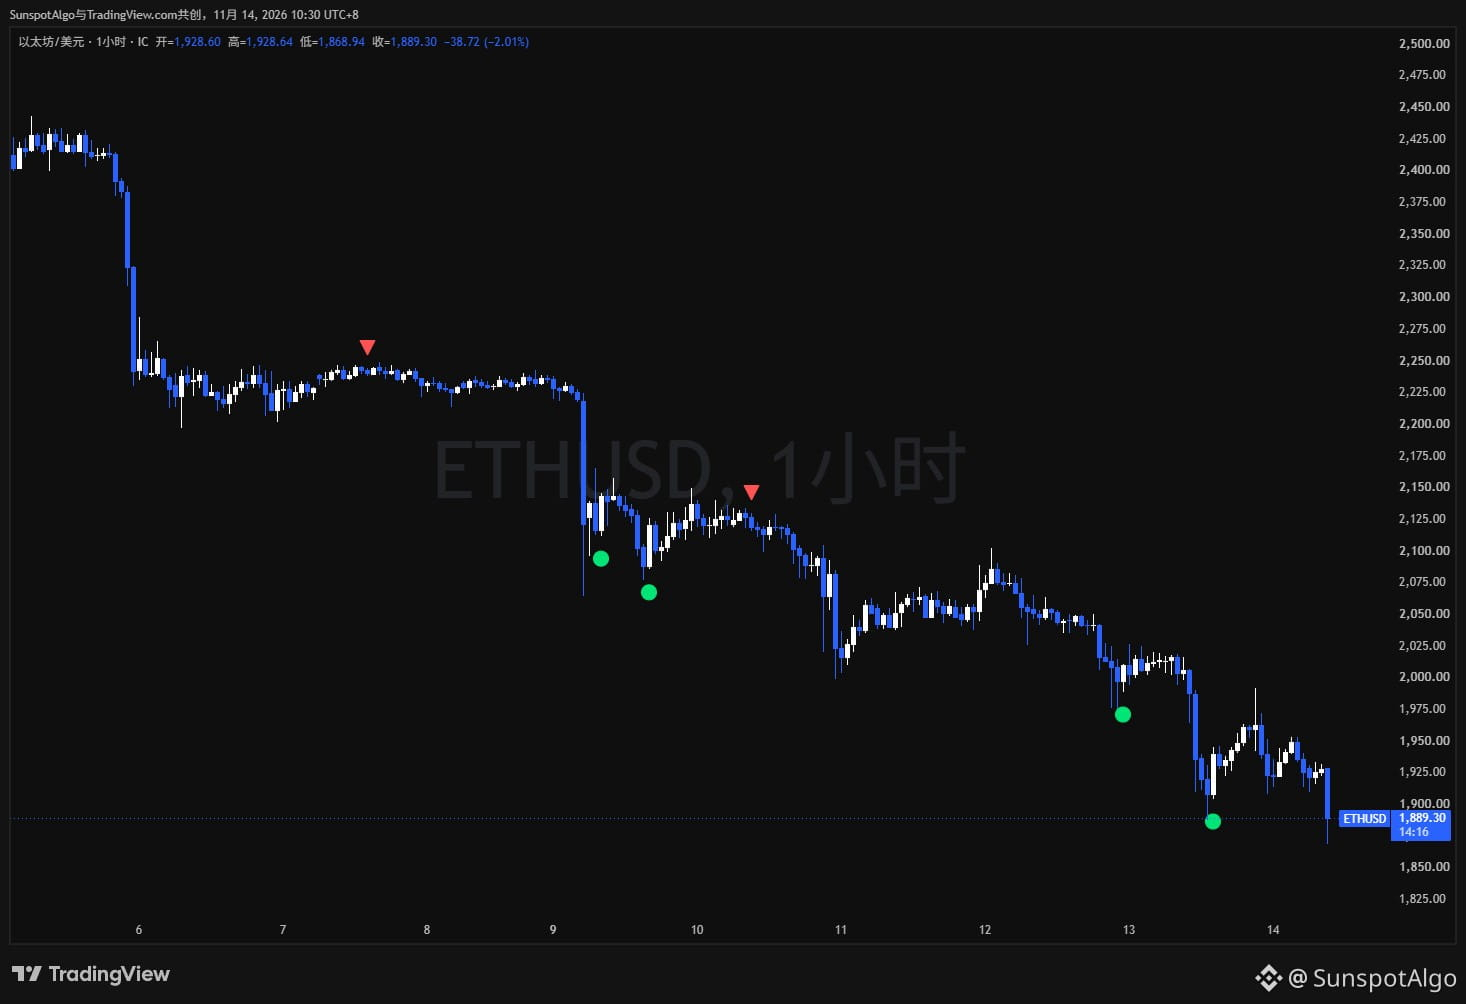
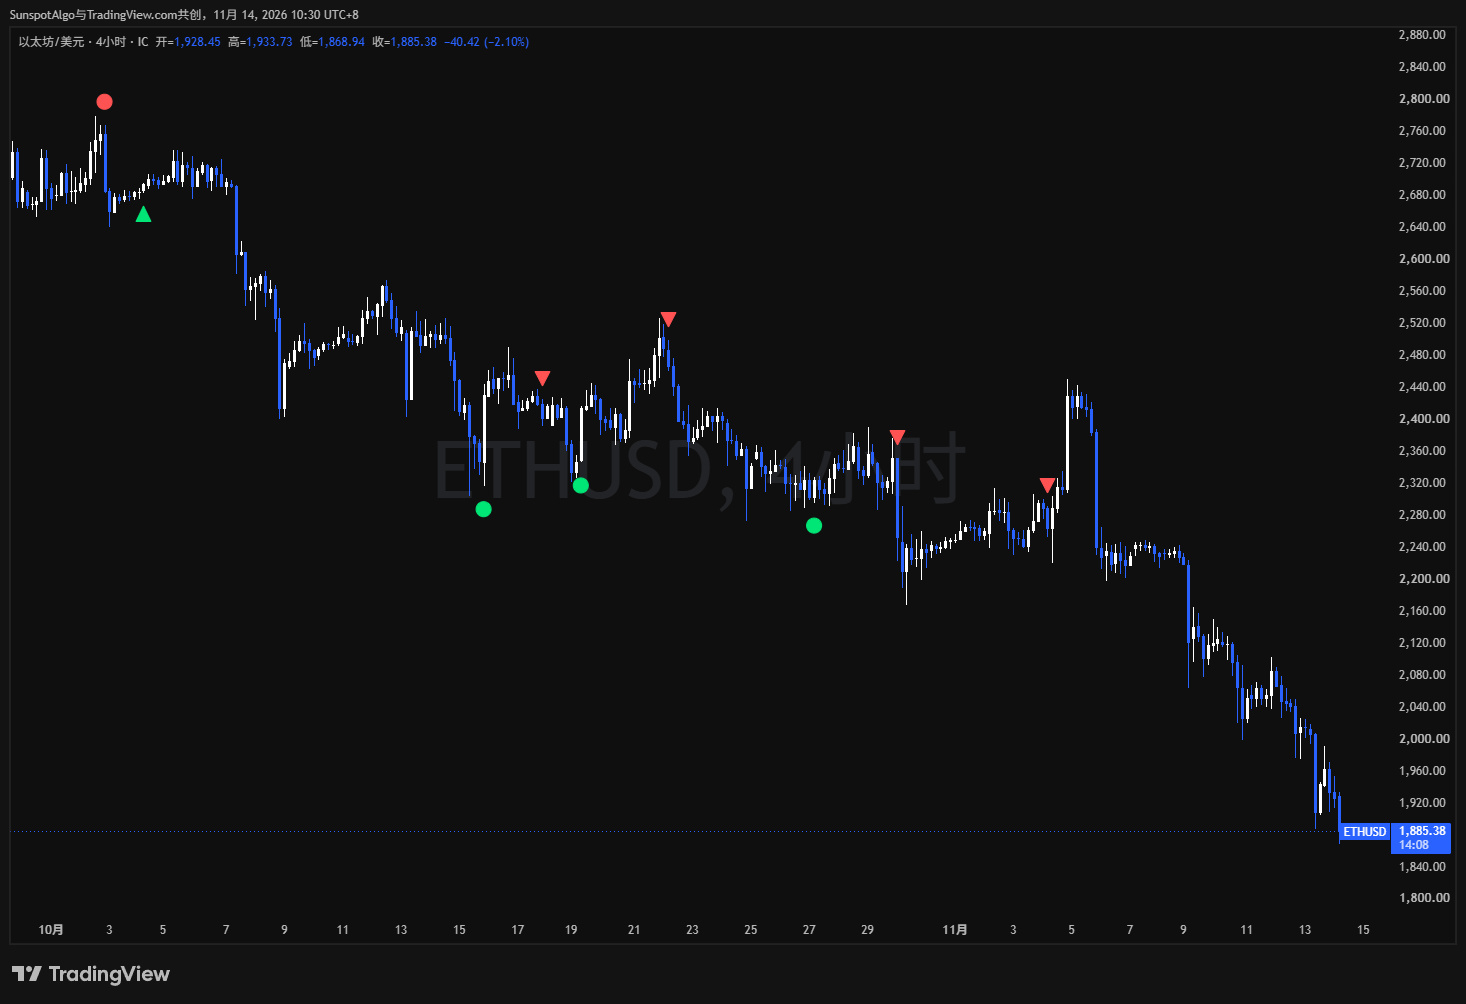
This time, I’m using ETH spot (ETH/USD) across four timeframes: 15 minutes, 30 minutes, 1 hour, and 4 hours. The screenshots were taken at the same time, with the same parameters throughout and no adjustments made for any individual timeframe.
MiX focuses on two things: trend continuation and market reversals.
🔴 Red indicates bearish, 🟢 green indicates bullish.
· Triangles: trend continuation
· Dots: reversal signals
· Diamonds: both types of signals appear together, indicating confluence
ETH was generally trending downward during this period. Across all four timeframes, bearish signals were mainly trend-following triangles, mostly appearing at local highs during rebounds. The diamond on the 30-minute chart marks where both types of signals coincided on the same candle. After the decline, the 1-hour and 4-hour charts showed a few green reversal dots, which went against the trend and were clearly outnumbered by bearish signals.
The same asset, independently triggered across four timeframes, yet using the same logic—that’s what I want you to see.
MiX uses candle-close confirmation: signals become valid only after the candle closes. Once confirmed, they don’t move or disappear. No future data is used, and historical markers are never altered after the fact (4-hour signals are automatically forwarded to our public channel).
Feel free to review historical screenshots in the channel (multiple assets and timeframes) and verify the win rate and risk-reward ratio for yourself.
Signal access: MiX 4-hour signals are automatically forwarded to the channel for free; the 15-minute, 30-minute, and 1-hour signals shown here are available only to authorized users.
MiX is currently available through individual authorization. If you’d like to learn about the indicator’s logic, how to use it, or authorization options, feel free to message me.
$ETH #ETH #Ethereum
This time, I’m using ETH spot (ETH/USD) across four timeframes: 15 minutes, 30 minutes, 1 hour, and 4 hours. The screenshots were taken at the same time, with the same parameters throughout and no adjustments made for any individual timeframe.
MiX focuses on two things: trend continuation and market reversals.
🔴 Red indicates bearish, 🟢 green indicates bullish.
· Triangles: trend continuation
· Dots: reversal signals
· Diamonds: both types of signals appear together, indicating confluence
ETH was generally trending downward during this period. Across all four timeframes, bearish signals were mainly trend-following triangles, mostly appearing at local highs during rebounds. The diamond on the 30-minute chart marks where both types of signals coincided on the same candle. After the decline, the 1-hour and 4-hour charts showed a few green reversal dots, which went against the trend and were clearly outnumbered by bearish signals.
The same asset, independently triggered across four timeframes, yet using the same logic—that’s what I want you to see.
MiX uses candle-close confirmation: signals become valid only after the candle closes. Once confirmed, they don’t move or disappear. No future data is used, and historical markers are never altered after the fact (4-hour signals are automatically forwarded to our public channel).
Feel free to review historical screenshots in the channel (multiple assets and timeframes) and verify the win rate and risk-reward ratio for yourself.
Signal access: MiX 4-hour signals are automatically forwarded to the channel for free; the 15-minute, 30-minute, and 1-hour signals shown here are available only to authorized users.
MiX is currently available through individual authorization. If you’d like to learn about the indicator’s logic, how to use it, or authorization options, feel free to message me.
$ETH #ETH #Ethereum