#strk Why did Starknet turn downward so sharply? 📉
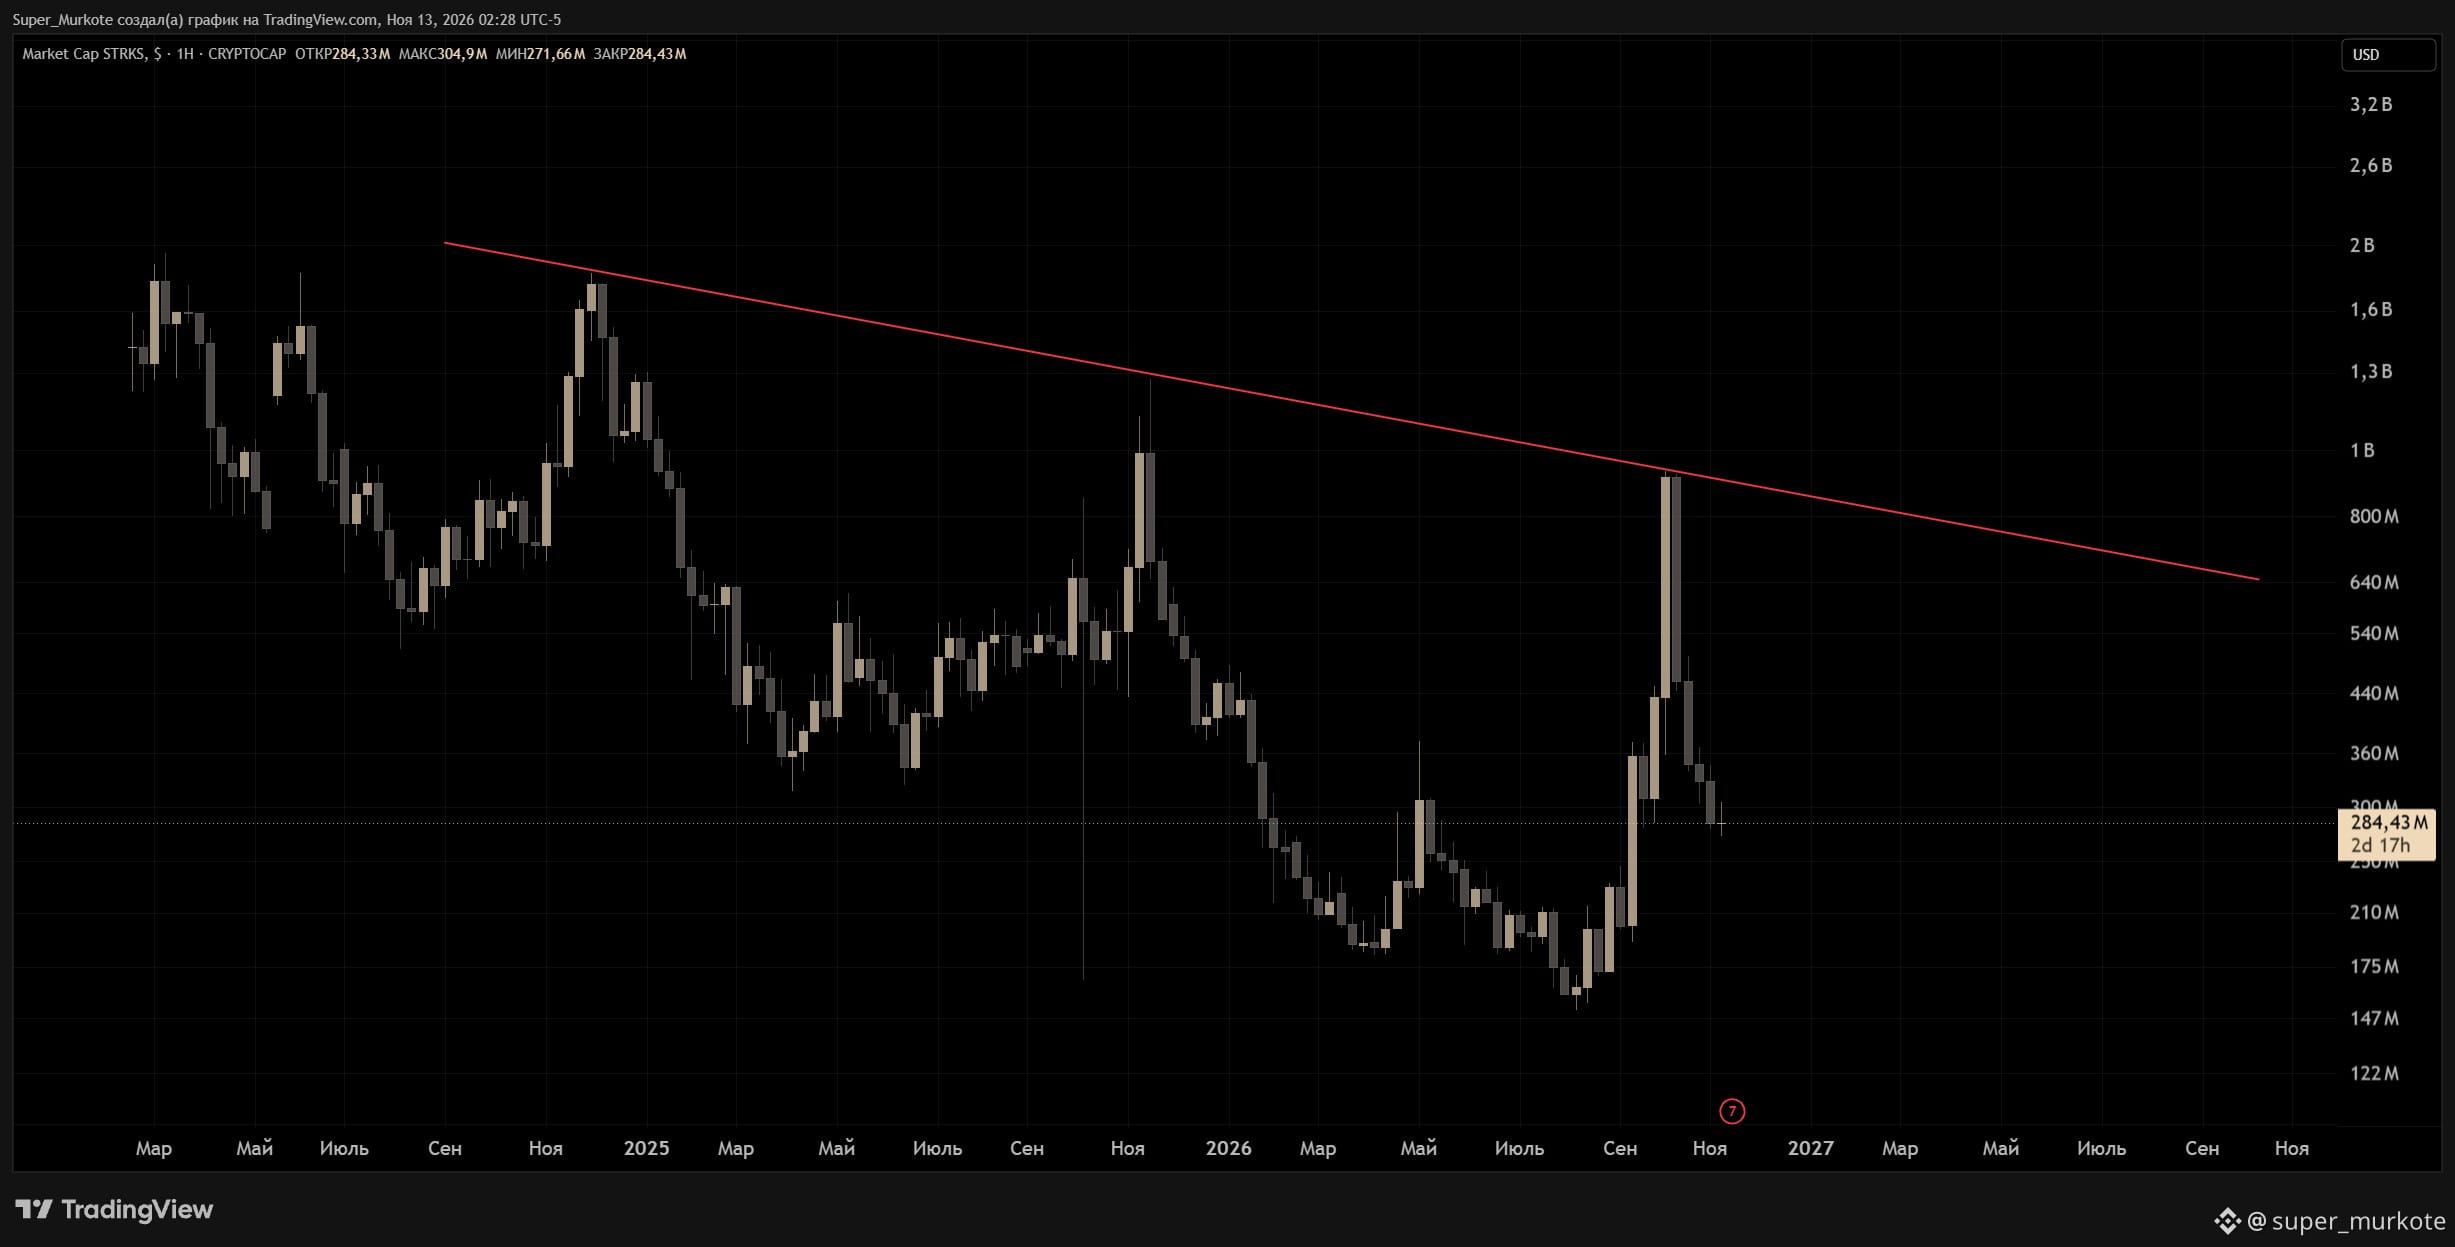
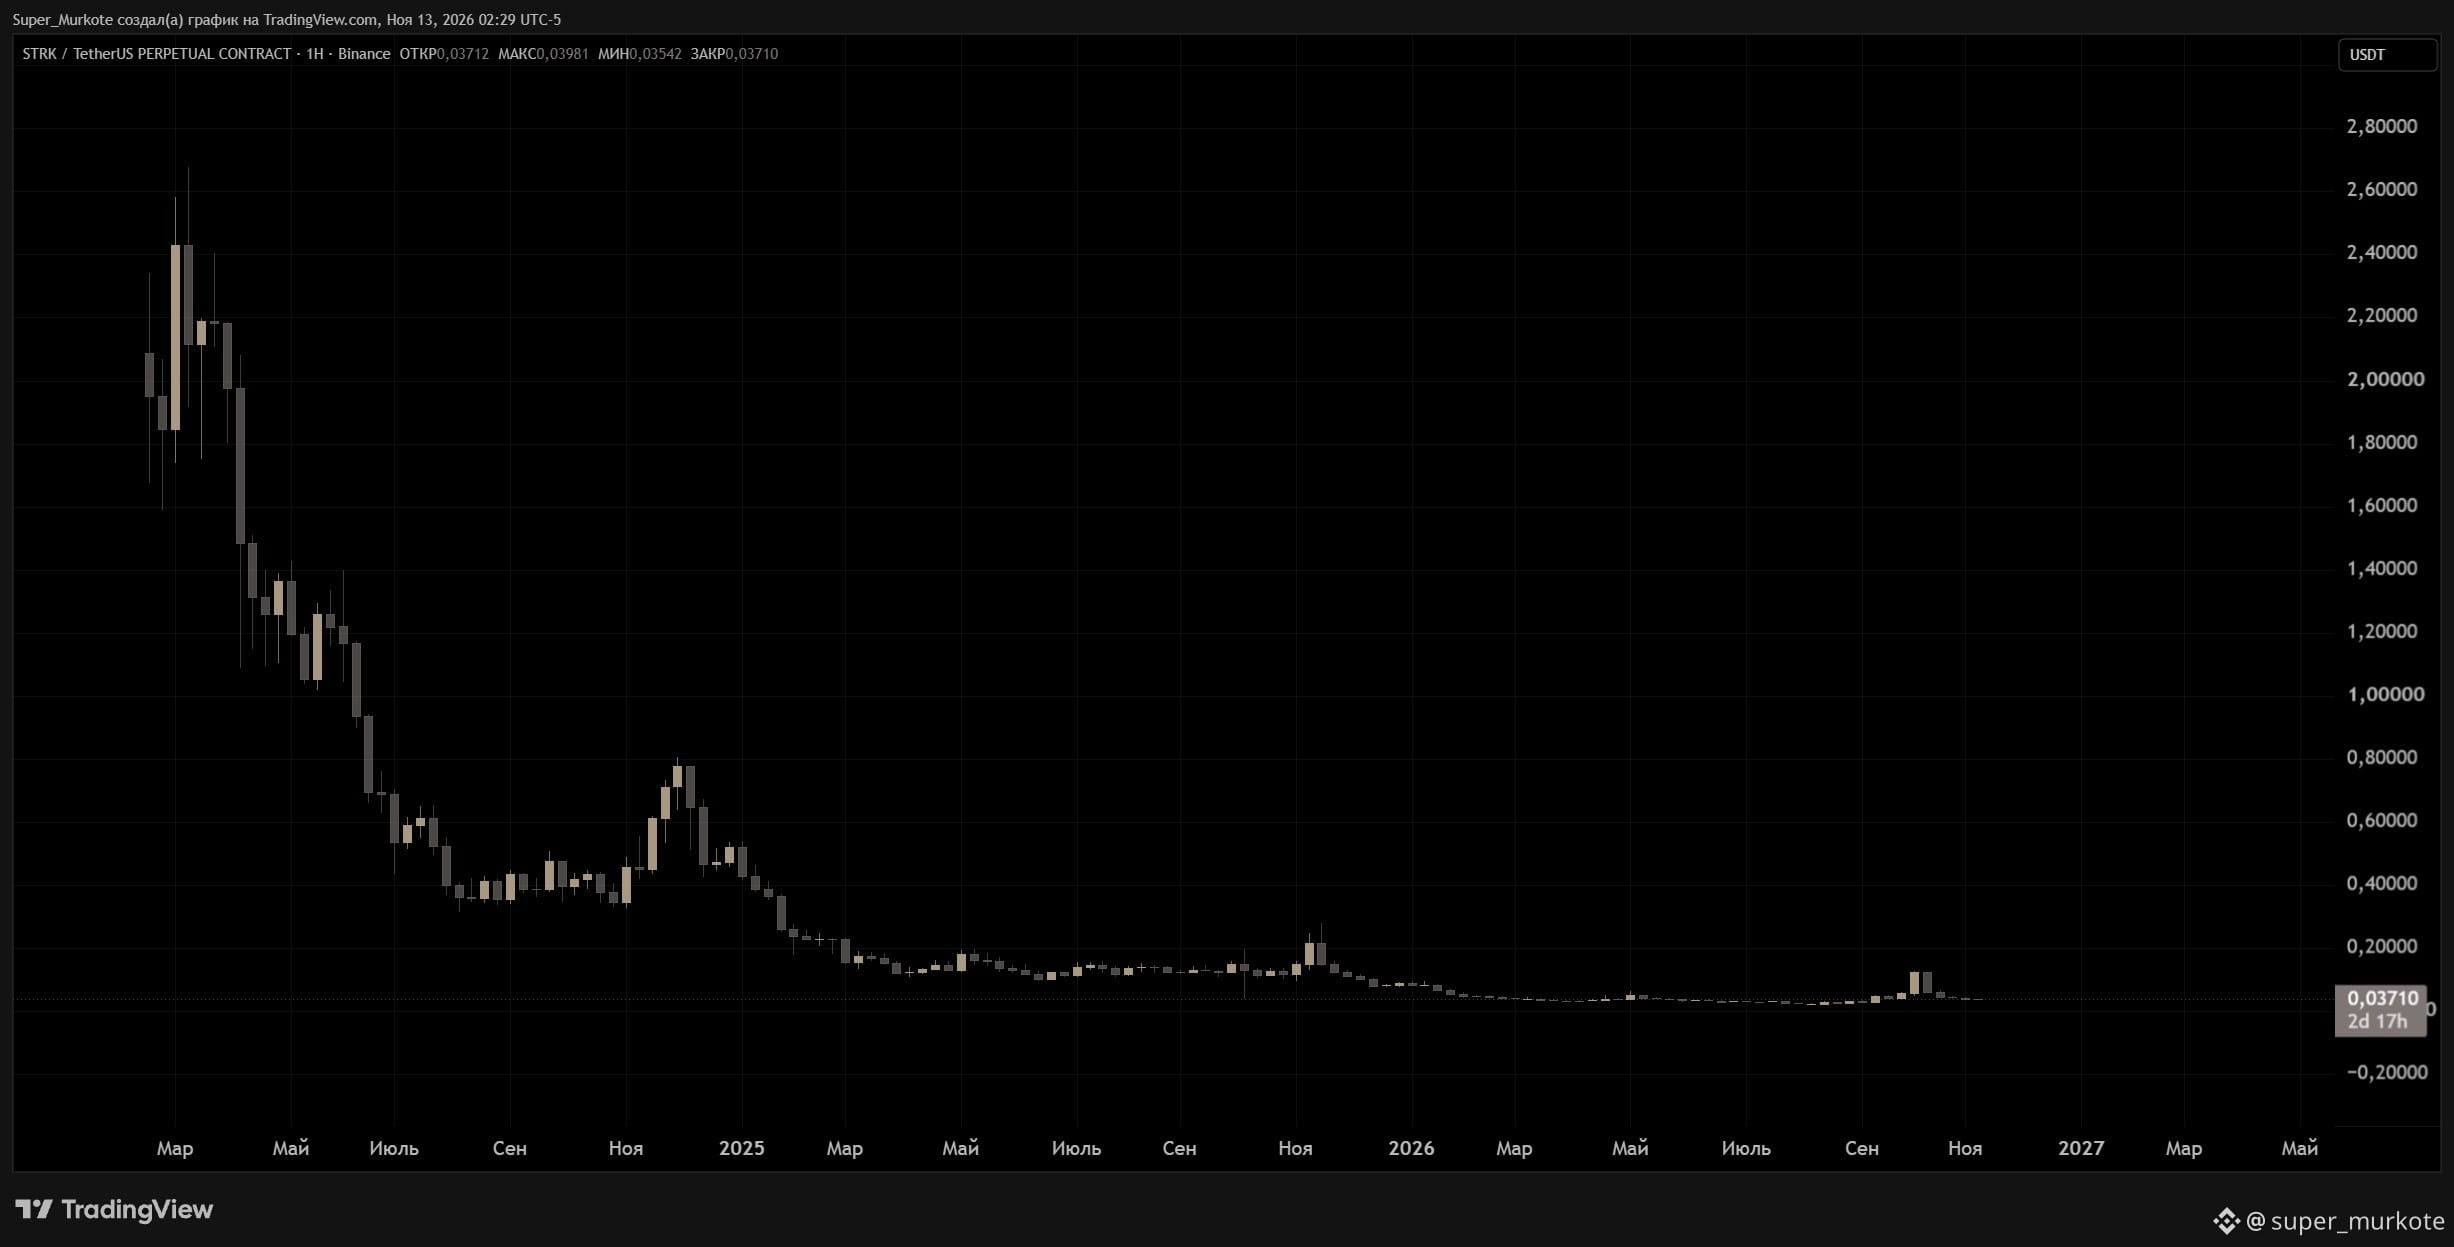
The price chart didn’t show particularly impressive growth, but switch to market capitalization and the picture becomes much more interesting.
STRK’s market capitalization approached a global descending trendline that has acted as resistance since 2024. This is where the upward momentum met a strong reaction from sellers.
Why such a divergence between price and market capitalization?
It’s because market capitalization depends not only on the token’s price, but also on the number of coins in circulation. An increase in circulating supply, including through token unlocks, could explain why market capitalization is approaching historical resistance levels even though the price itself remains far below its previous highs.
So the reversal may have been linked to reaching an important technical area on the market capitalization chart.
Sometimes the price chart tells only half the story. 😉
The price chart didn’t show particularly impressive growth, but switch to market capitalization and the picture becomes much more interesting.
STRK’s market capitalization approached a global descending trendline that has acted as resistance since 2024. This is where the upward momentum met a strong reaction from sellers.
Why such a divergence between price and market capitalization?
It’s because market capitalization depends not only on the token’s price, but also on the number of coins in circulation. An increase in circulating supply, including through token unlocks, could explain why market capitalization is approaching historical resistance levels even though the price itself remains far below its previous highs.
So the reversal may have been linked to reaching an important technical area on the market capitalization chart.
Sometimes the price chart tells only half the story. 😉