🚀 $AGT : Catching a move from strong support!
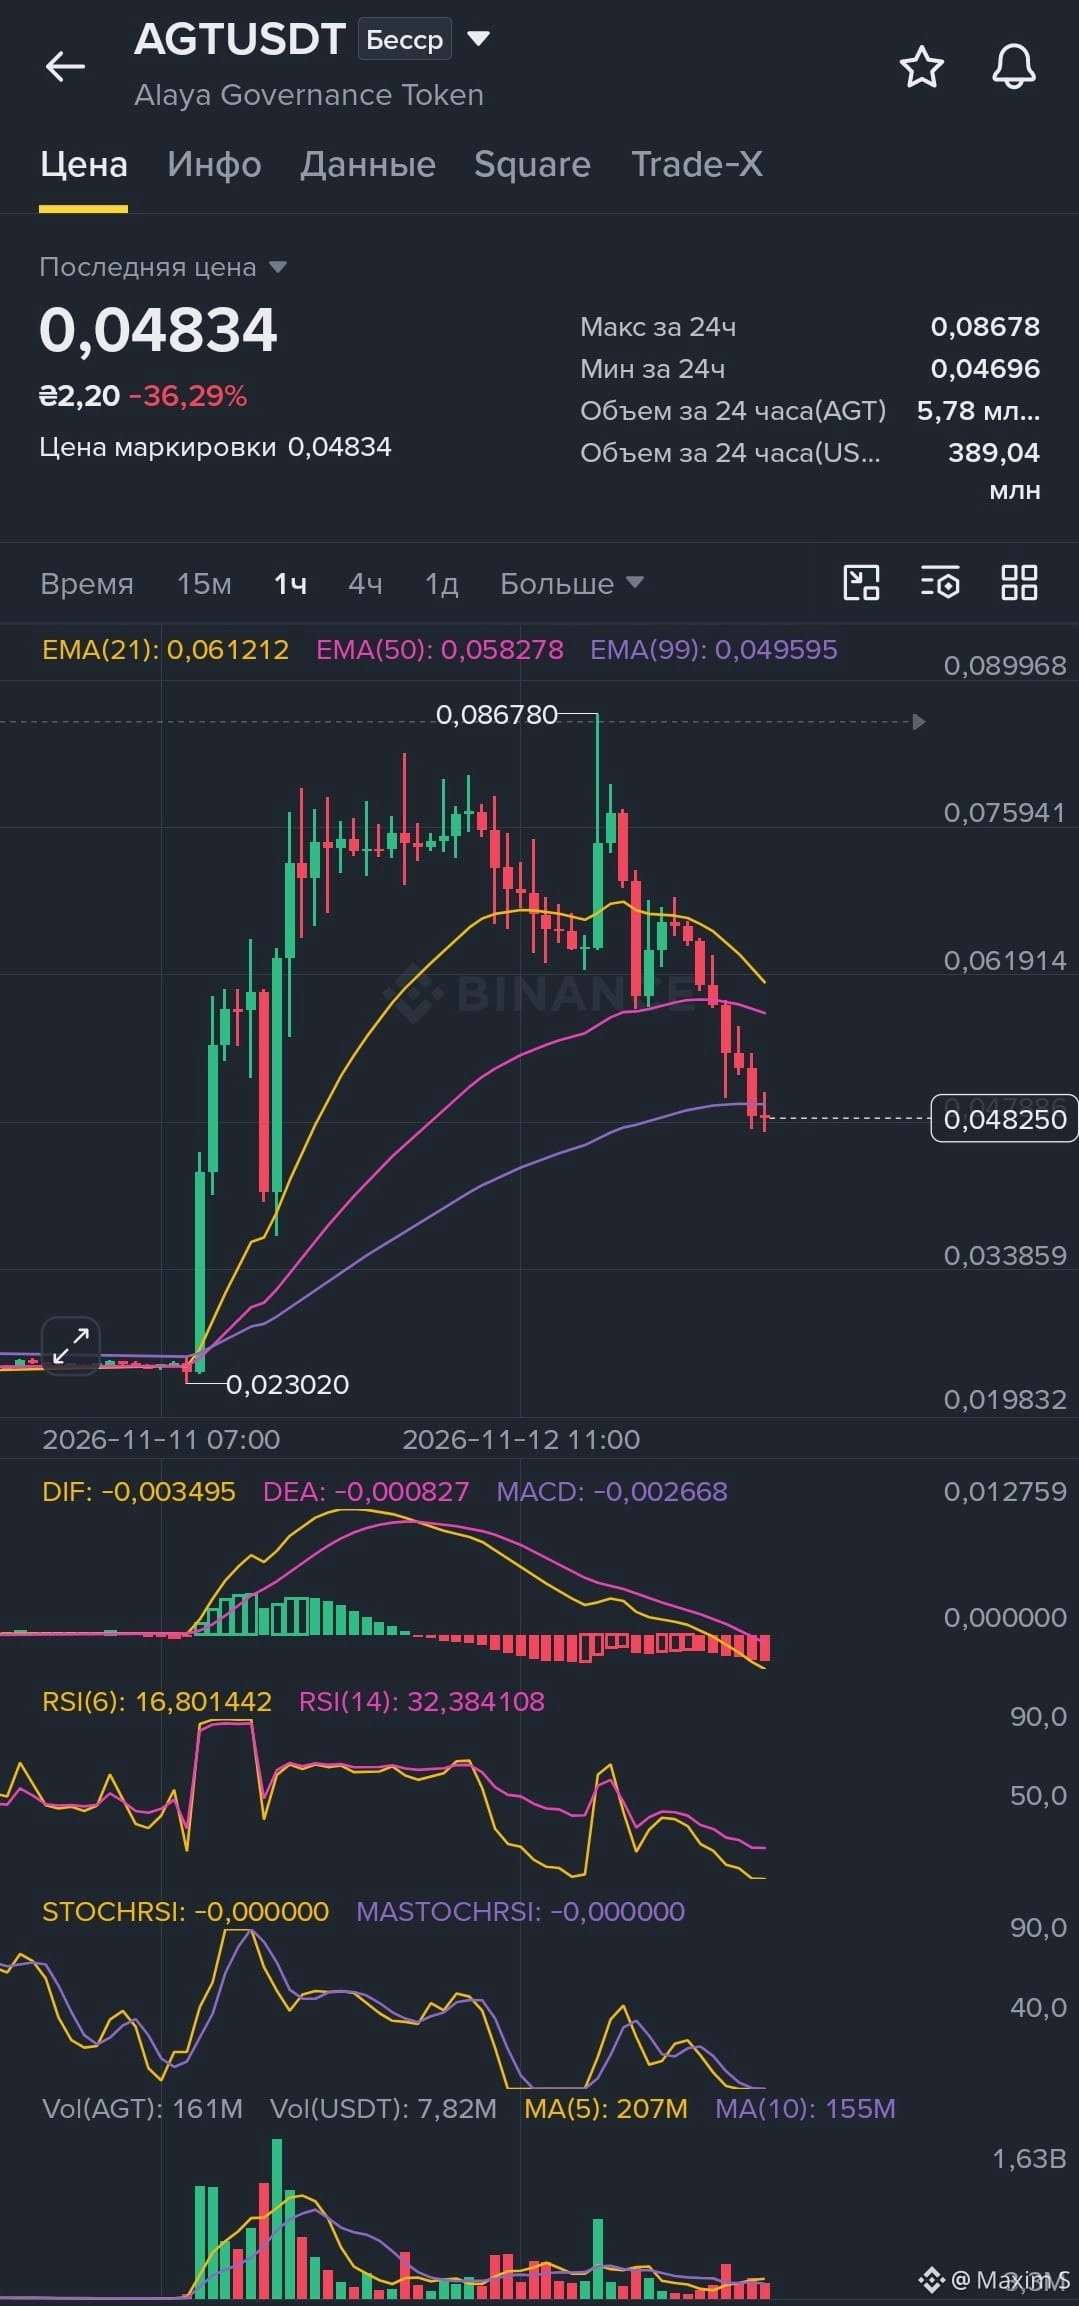
After a powerful impulsive rise, $AGT on the 1-hour timeframe entered a natural correction, falling by more than 36%. The price is now testing a strategically important zone—the EMA(99) moving average, which acts as a strong dynamic support level. The RSI indicators are in oversold territory, increasing the likelihood of a local technical rebound. If you’re planning to join the move, let’s go over a detailed trading plan. Share your thoughts in the comments and keep an eye on the risks!
📊 Trading plan: Main scenario — LONG 🟢
Main scenario: A local rebound from the EMA(99) zone after an impulsive decline.
Entry points:
Aggressive: 0.04800 – 0.04834 USDT (current levels near EMA(99)).
Conservative: 0.04650 – 0.04700 USDT (in case of a false breakdown and liquidity sweep at the lows).
Stop-loss: 0.04450 USDT (a move below the support zone would invalidate the bullish scenario).
Targets:
Target 1: 0.05350 USDT (~+11%)
Target 2: 0.05850 USDT (~+21%)
Target 3: 0.06500 USDT (~+35%)
Trade 👉$AGT
After a powerful impulsive rise, $AGT on the 1-hour timeframe entered a natural correction, falling by more than 36%. The price is now testing a strategically important zone—the EMA(99) moving average, which acts as a strong dynamic support level. The RSI indicators are in oversold territory, increasing the likelihood of a local technical rebound. If you’re planning to join the move, let’s go over a detailed trading plan. Share your thoughts in the comments and keep an eye on the risks!
📊 Trading plan: Main scenario — LONG 🟢
Main scenario: A local rebound from the EMA(99) zone after an impulsive decline.
Entry points:
Aggressive: 0.04800 – 0.04834 USDT (current levels near EMA(99)).
Conservative: 0.04650 – 0.04700 USDT (in case of a false breakdown and liquidity sweep at the lows).
Stop-loss: 0.04450 USDT (a move below the support zone would invalidate the bullish scenario).
Targets:
Target 1: 0.05350 USDT (~+11%)
Target 2: 0.05850 USDT (~+21%)
Target 3: 0.06500 USDT (~+35%)
Trade 👉$AGT