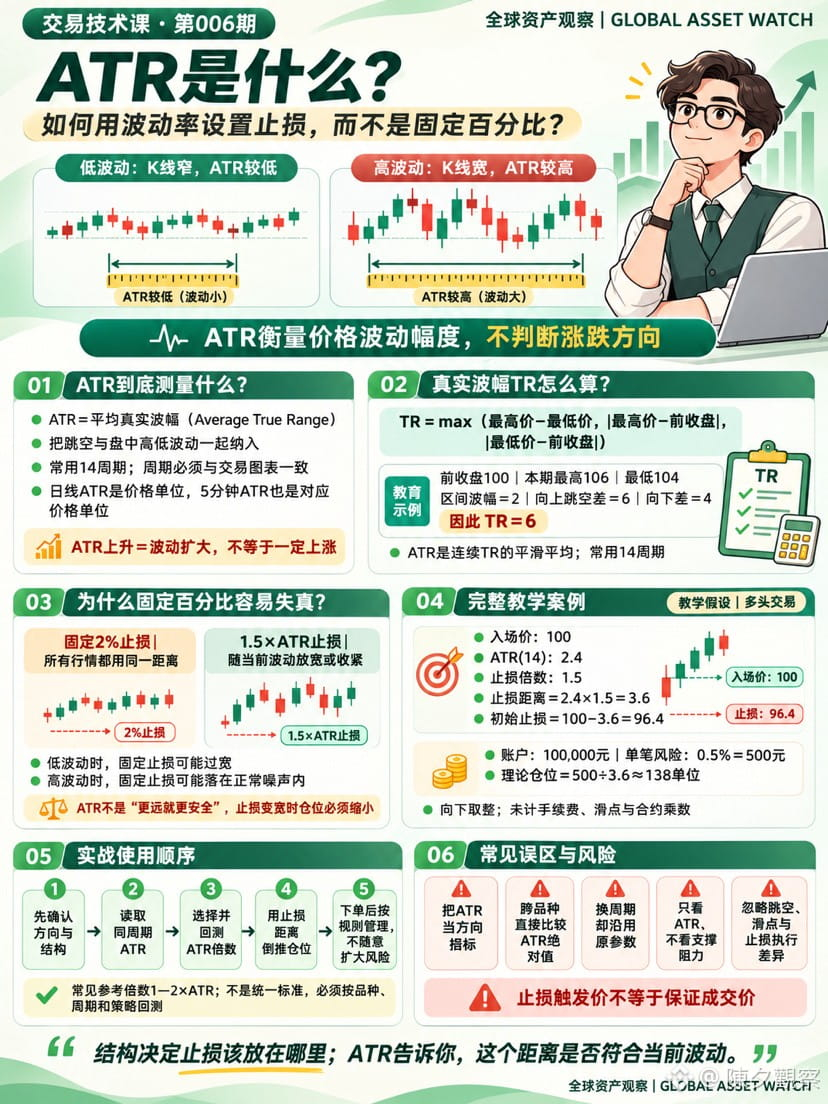
What is ATR? How can you use volatility to set stop-losses instead of a fixed percentage?
📏 If you set the same 2% stop-loss, why is it too wide for some instruments, yet easily hit by normal price fluctuations for others?
ATR (Average True Range) measures the average price movement over a specified period, including gaps. It reflects the size of price movements, not their direction.
True range is the largest of the following three values:
TR = max(high − low, |high − previous close|, |low − previous close|)
ATR commonly uses a 14-period setting, which should match the chart timeframe: daily ATR reflects daily volatility, while 5-minute ATR reflects 5-minute volatility.
Example:
Long entry price: 100
ATR(14): 2.4
Stop-loss multiplier: 1.5
Stop-loss distance: 2.4 × 1.5 = 3.6
Initial stop-loss: 100 − 3.6 = 96.4
Account balance: 100,000 yuan; risk per trade: 0.5% = 500 yuan
Theoretical position size: 500 ÷ 3.6 ≈ 138 units
The point is not to mechanically place stop-losses farther away, but to understand that:
Higher volatility → greater stop-loss distance → proportionally smaller position size.
1–2 × ATR is a common reference, not a universal standard. The specific multiplier should be backtested for the instrument, timeframe, and strategy. In practice, first consider the trend, support and resistance, and the structure that would invalidate your trade; then use ATR to assess whether the stop-loss distance fits current volatility.
⚠️ ATR is a historical volatility indicator and cannot predict gaps or extreme market conditions. The stop-loss trigger price is not necessarily the execution price; fast-moving markets may result in slippage.
Structure determines the stop-loss level; ATR helps assess whether that distance fits current volatility.
Coming next | Saturday · Trading in Practice · Episode 006
《How to Put ATR Stop-Losses into Practice: A Complete Case Study from Entry and Position Sizing to Trailing Stops》
📏 If you set the same 2% stop-loss, why is it too wide for some instruments, yet easily hit by normal price fluctuations for others?
ATR (Average True Range) measures the average price movement over a specified period, including gaps. It reflects the size of price movements, not their direction.
True range is the largest of the following three values:
TR = max(high − low, |high − previous close|, |low − previous close|)
ATR commonly uses a 14-period setting, which should match the chart timeframe: daily ATR reflects daily volatility, while 5-minute ATR reflects 5-minute volatility.
Example:
Long entry price: 100
ATR(14): 2.4
Stop-loss multiplier: 1.5
Stop-loss distance: 2.4 × 1.5 = 3.6
Initial stop-loss: 100 − 3.6 = 96.4
Account balance: 100,000 yuan; risk per trade: 0.5% = 500 yuan
Theoretical position size: 500 ÷ 3.6 ≈ 138 units
The point is not to mechanically place stop-losses farther away, but to understand that:
Higher volatility → greater stop-loss distance → proportionally smaller position size.
1–2 × ATR is a common reference, not a universal standard. The specific multiplier should be backtested for the instrument, timeframe, and strategy. In practice, first consider the trend, support and resistance, and the structure that would invalidate your trade; then use ATR to assess whether the stop-loss distance fits current volatility.
⚠️ ATR is a historical volatility indicator and cannot predict gaps or extreme market conditions. The stop-loss trigger price is not necessarily the execution price; fast-moving markets may result in slippage.
Structure determines the stop-loss level; ATR helps assess whether that distance fits current volatility.
Coming next | Saturday · Trading in Practice · Episode 006
《How to Put ATR Stop-Losses into Practice: A Complete Case Study from Entry and Position Sizing to Trailing Stops》