🚀 Quick Analysis: $NVDAB /USDT in Action 📈
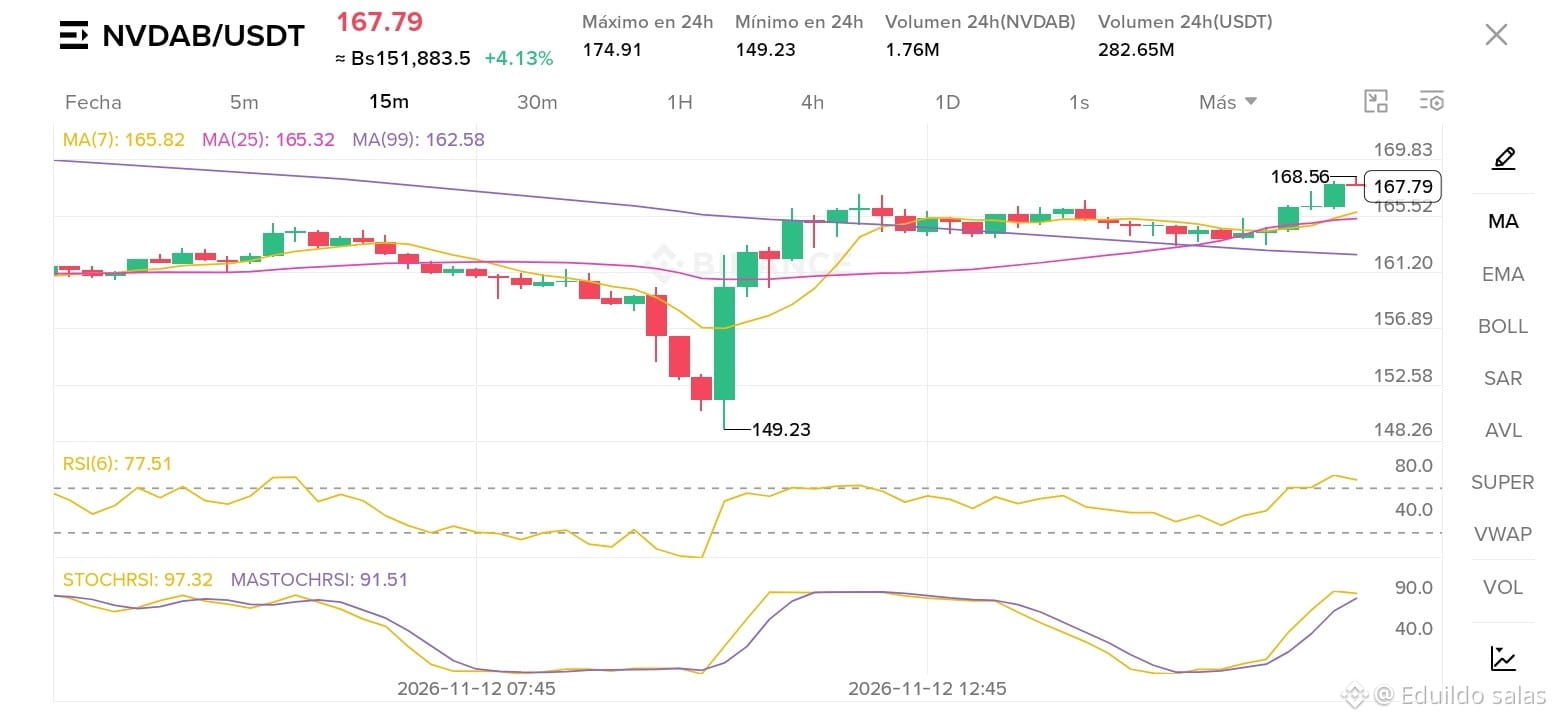
The NVDAB/USDT pair is showing some very interesting movement on the 15-minute chart. After hitting a low of 149.23 USDT, the price has staged a strong bullish recovery and is currently trading at 167.79 USDT (a solid +4.13% over the past 24 hours).
🔍 Key technical details:
Moving Average (MA) crossover: The fast MA(7) at 165.82 has crossed above the MA(25) (165.32) and is moving away from the MA(99) (162.58), confirming short-term bullish momentum.
RSI(6) in strong territory: It stands at 77.51, reflecting dominant buying pressure and active bullish strength.
StochRSI: At high levels (97.32 and 91.51), suggesting the asset is in a zone of intense buying activity.
💡 Outlook: The price is breaking through local resistance and aims to consolidate above the 167–168 USDT zone. Keep a close eye on volume to see if it can reach the 24-hour high of 174.91 USDT!
What do you think of this move? Are you accumulating or waiting for a retest? Let me know in the comments! 👇
#NVDAB #BinanceSquare #HuangExitNvidiaStrategyInFocus
The NVDAB/USDT pair is showing some very interesting movement on the 15-minute chart. After hitting a low of 149.23 USDT, the price has staged a strong bullish recovery and is currently trading at 167.79 USDT (a solid +4.13% over the past 24 hours).
🔍 Key technical details:
Moving Average (MA) crossover: The fast MA(7) at 165.82 has crossed above the MA(25) (165.32) and is moving away from the MA(99) (162.58), confirming short-term bullish momentum.
RSI(6) in strong territory: It stands at 77.51, reflecting dominant buying pressure and active bullish strength.
StochRSI: At high levels (97.32 and 91.51), suggesting the asset is in a zone of intense buying activity.
💡 Outlook: The price is breaking through local resistance and aims to consolidate above the 167–168 USDT zone. Keep a close eye on volume to see if it can reach the 24-hour high of 174.91 USDT!
What do you think of this move? Are you accumulating or waiting for a retest? Let me know in the comments! 👇
#NVDAB #BinanceSquare #HuangExitNvidiaStrategyInFocus