
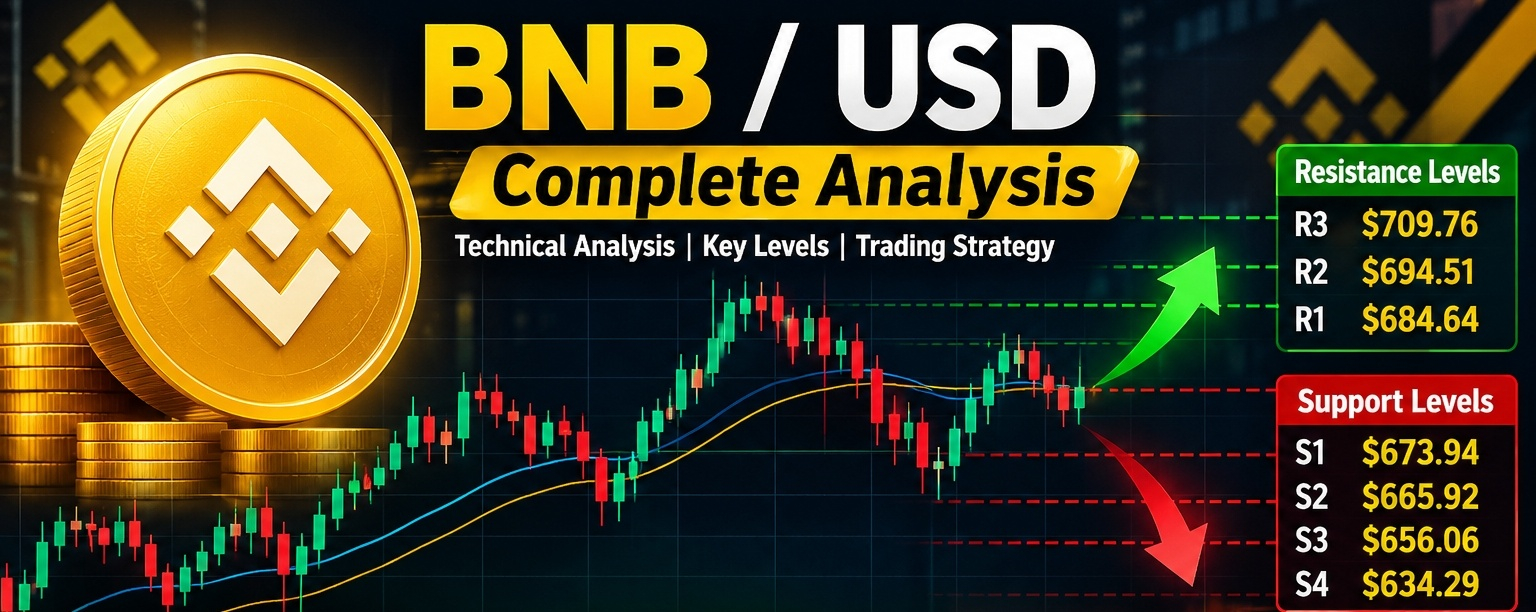

$BNB /USD – Complete Cryptocurrency Analysis
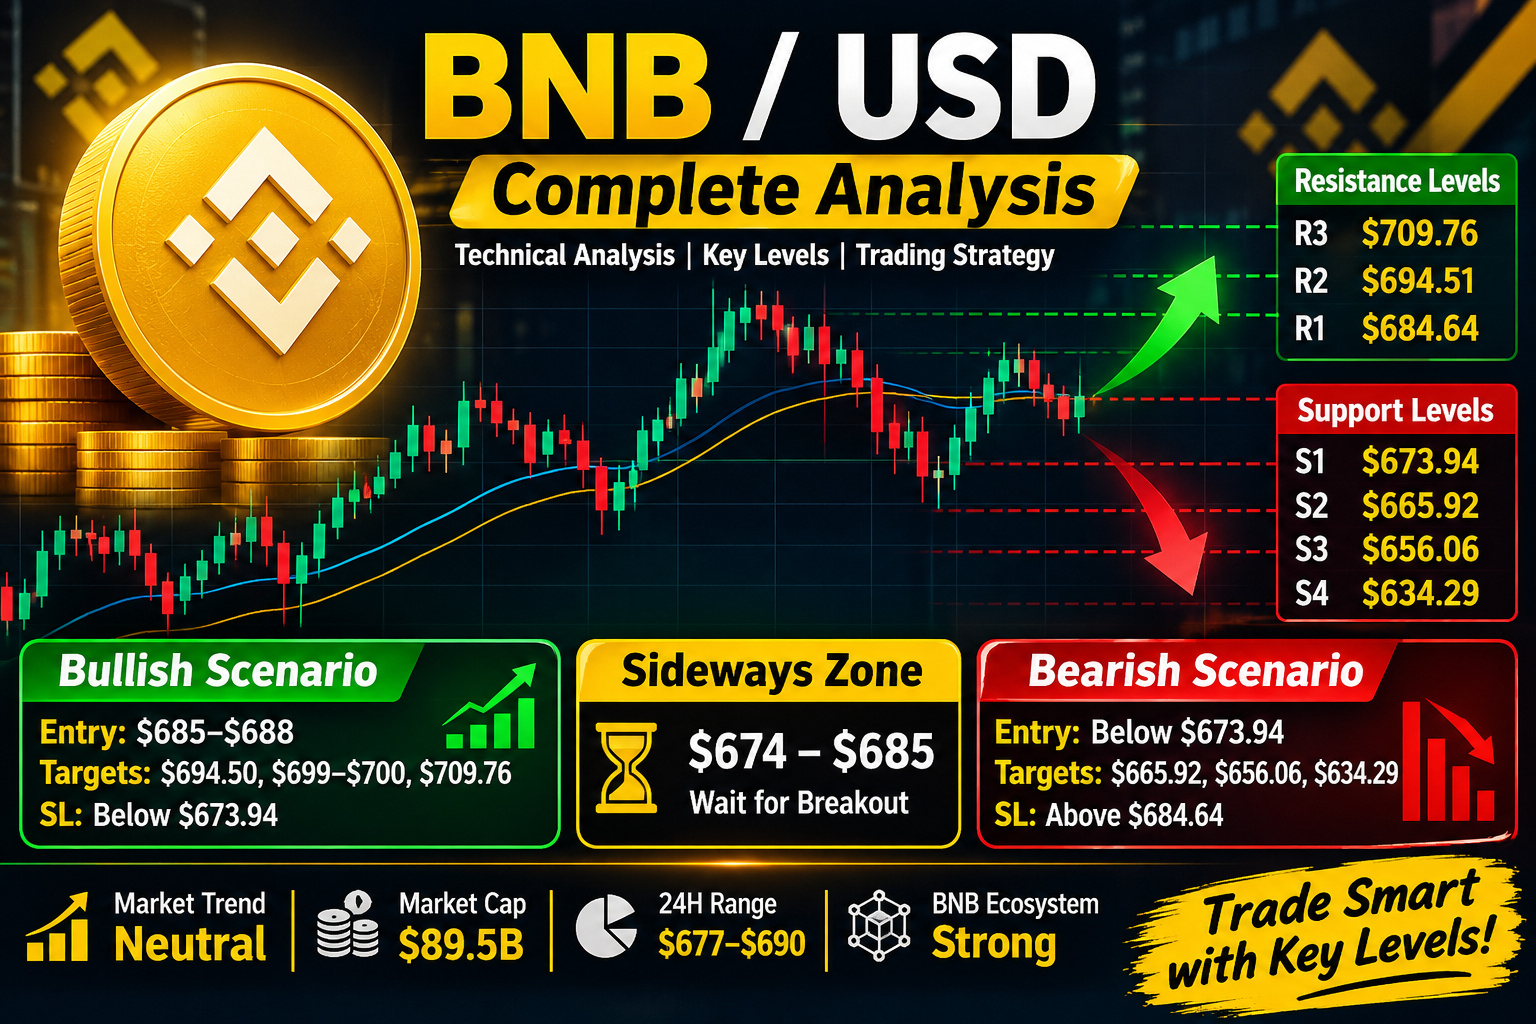
BNB (Binance Coin)
Technical analysis • Market fundamentals • Trading strategy
$BNB is the native cryptocurrency of the BNB ecosystem. It is used for transaction fees, staking, DeFi applications, and other services across BNB Chain.

This analysis covers the factors to consider before opening a BNB/USD long or short position. Exact entry and exit levels should be based on verified live prices rather than guessed figures.
### 1\. Current BNB market overview
Short-term bearish / Daily neutral
Market snapshot: November 12, 2026. Exchange prices may differ.
BNB reference price
### $677.31
Coinotag daily snapshot
Market capitalization
### $89.5B
Approximate
24-hour range
$677–$690
CoinGlass snapshot
Circulating supply
131.51M BNB
Approximate
COINOTAG +1
### 2\. Important support and resistance levels
These are the key daily-chart levels to watch.
| Level | Price (USD) | Importance |
| ----------------- | ----------- | ------------- |
| Resistance 3 | $709.76 | Strong |
| Resistance 2 | $694.51 | Strong |
| Resistance 1 | $684.64 | Important |
| Current reference | $677.31 | — |
| Support 1 | $673.94 | Very strong |
| Support 2 | $665.92 | Strong |
| Support 3 | $656.06 | Important |
| Support 4 | $634.29 | Lower support |
COINOTAG
![Binance Coin ($BNB ) Price: Technical Analysis Shows Bullish Momentum Building Toward $700 - CoinCentral]
Important price zones:
* $673–$674: First major buying-defense zone.
* $665–$666: Next downside support.
* $684–$685: First important bullish breakout level.
* $694–$695: Major resistance.
* $709–$710: Next upside target zone.
### 3\. Technical indicator analysis
| Indicator | Reading | Interpretation |
| ------------ | -------------- | ------------------- |
| Daily RSI | 37 | Weak momentum |
| 4H RSI | 39.8 | Bearish pressure |
| Weekly RSI | 48.2 | Nearly neutral |
| MACD | Sell | Bearish momentum |
| Daily trend | Neutral | Consolidation |
| 4H trend | Strong bearish | Short-term weakness |
| Weekly trend | Strong bullish | Longer-term support |
Investing.com CA +1
What does this mean?
* RSI around 37 indicates weak buying momentum, but is not yet deeply oversold.
* The bearish MACD suggests buyers have not regained control.
* The weekly trend is more constructive than the 4-hour trend.
* A short-term recovery is possible, but confirmation is needed.
### 4\. BNB trading scenarios
Scenario A – Bullish
Conditional BUY
### $684.64
Breakout confirmation level.
* Entry: $685–$688 after a confirmed breakout and retest.
* Target 1: $694.50
* Target 2: $699–$700
* Target 3: $709.76
* Invalidation: Sustained move back below $673.94.
A daily close above $684.64 would improve the bullish outlook.
Scenario B – Bearish
Conditional SELL
### $673.94
Breakdown confirmation level.
* Entry: Below $673 after a confirmed breakdown and failed retest.
* Target 1: $665.92
* Target 2: $656.06
* Target 3: $634.29
* Invalidation: Recovery above $684.64.
A confirmed daily close below $673.94 would strengthen the bearish case.
Scenario C – Sideways
Wait
$674–$685
If BNB remains inside this range, avoid chasing the price. Wait for a confirmed breakout or breakdown.
These are conditional trading plans, not guaranteed signals. Use a stop-loss and account for fees and slippage.
### 5\. Futures market analysis
BNB derivatives data provides some useful clues:
* Futures trading volume: approximately $495.28M.
* Spot trading volume: approximately $72.20M.
* Open interest: approximately $1.08B.
* Funding rate: +0.0031%.
* Long liquidations: approximately $540K.
* Short liquidations: approximately $100K.
CoinGlass
Interpretation: Futures activity is substantially higher than spot activity. Long positions have experienced more liquidations than shorts in the reported period. This makes leveraged trading risky, particularly around support and resistance levels.
### 6\. Fundamental analysis
BNB has several fundamental strengths:
* BNB Chain: Supports decentralized applications and smart contracts.
* Transaction fees: BNB is used to pay network fees.
* Token burns: Periodic burns reduce the available token supply.
* DeFi ecosystem: Supports decentralized exchanges, lending and liquidity applications.
* Ecosystem adoption: More network activity can increase demand for BNB.
However, regulatory developments, competition from other blockchains, Binance-related risks and declining network activity can negatively affect its price.
### 7\. Fibonacci analysis
Based on the recent daily swing from $585.30 to $809.99:
| Fibonacci level | Price |
| --------------- | ------- |
| 38.2% | $724.16 |
| 50% | $697.65 |
| 61.8% | $671.13 |
| 78.6% | $633.38 |
COINOTAG
The $671–$674 region is particularly important because Fibonacci support overlaps with the nearby technical support zone.
### 8\. Risk management
For a hypothetical $1,000 trading account:
| Risk per trade | Maximum loss |
| -------------- | ------------ |
| 0.5% | $5 |
| 1% | $10 |
| 2% | $20 |
My suggestion:
* Risk only 0.5–1% per trade.
* Avoid excessive futures leverage.
* Don't enter a trade just because RSI is low.
* Wait for candle-close confirmation.
* Avoid moving your stop-loss farther away to prevent a loss.
### 9\. Final BNB/USD outlook
My overall assessment
Short-term (4H)
Bearish
Medium-term (1D)
Neutral
Longer-term (1W)
Bullish bias
Most important levels
Bullish confirmation
### $684.64
Bearish confirmation
### $673.94
My preferred approach: Wait for a confirmed breakout above $684.64 or breakdown below $673.94. Avoid opening a large position while BNB is trapped between these levels.
Important: Different data providers show slightly different BNB prices. Verify the live Binance BNB/USDT chart before placing an order. The figures above are technical reference levels, not live executable quotes.
Market data sources:
* [Binance – BNB live price](https://www.binance.com/en/price/bnb?utm_source=chatgpt.com)
* [Coinotag – BNB technical analysis](https://en.coinotag.com/cryptocurrencies/spot/BNB/technical-analysis?utm_source=chatgpt.com)
* [CoinGlass – BNB futures and market data](https://www.coinglass.com/currencies/BNB?filter_by=popular&utm_source=chatgpt.com)
* [Investing.com – BNB technical indicators](https://ca.investing.com/crypto/bnb/bnb-usd-technical?utm_source=chatg
pt.com)
### 10\. What analysis should we do next?
Customize your BNB trading plan
Choose your trading timeframe
Scalping (5m–15m)
Intraday (1H–4H)
Swing trading (1D)
Long-term investment (1W)
Trading pair
BNB/USDT
BNB/USD
Trading capital (USD)
Create my BNB trading plan
#BNB_Market_Update #BNB走势 #BNBUSDT #BNBAnalysis #TrendingPredictions