🟢 SKYAI/USDT (1h) — bounce off EMA99, test of dynamic support 📈
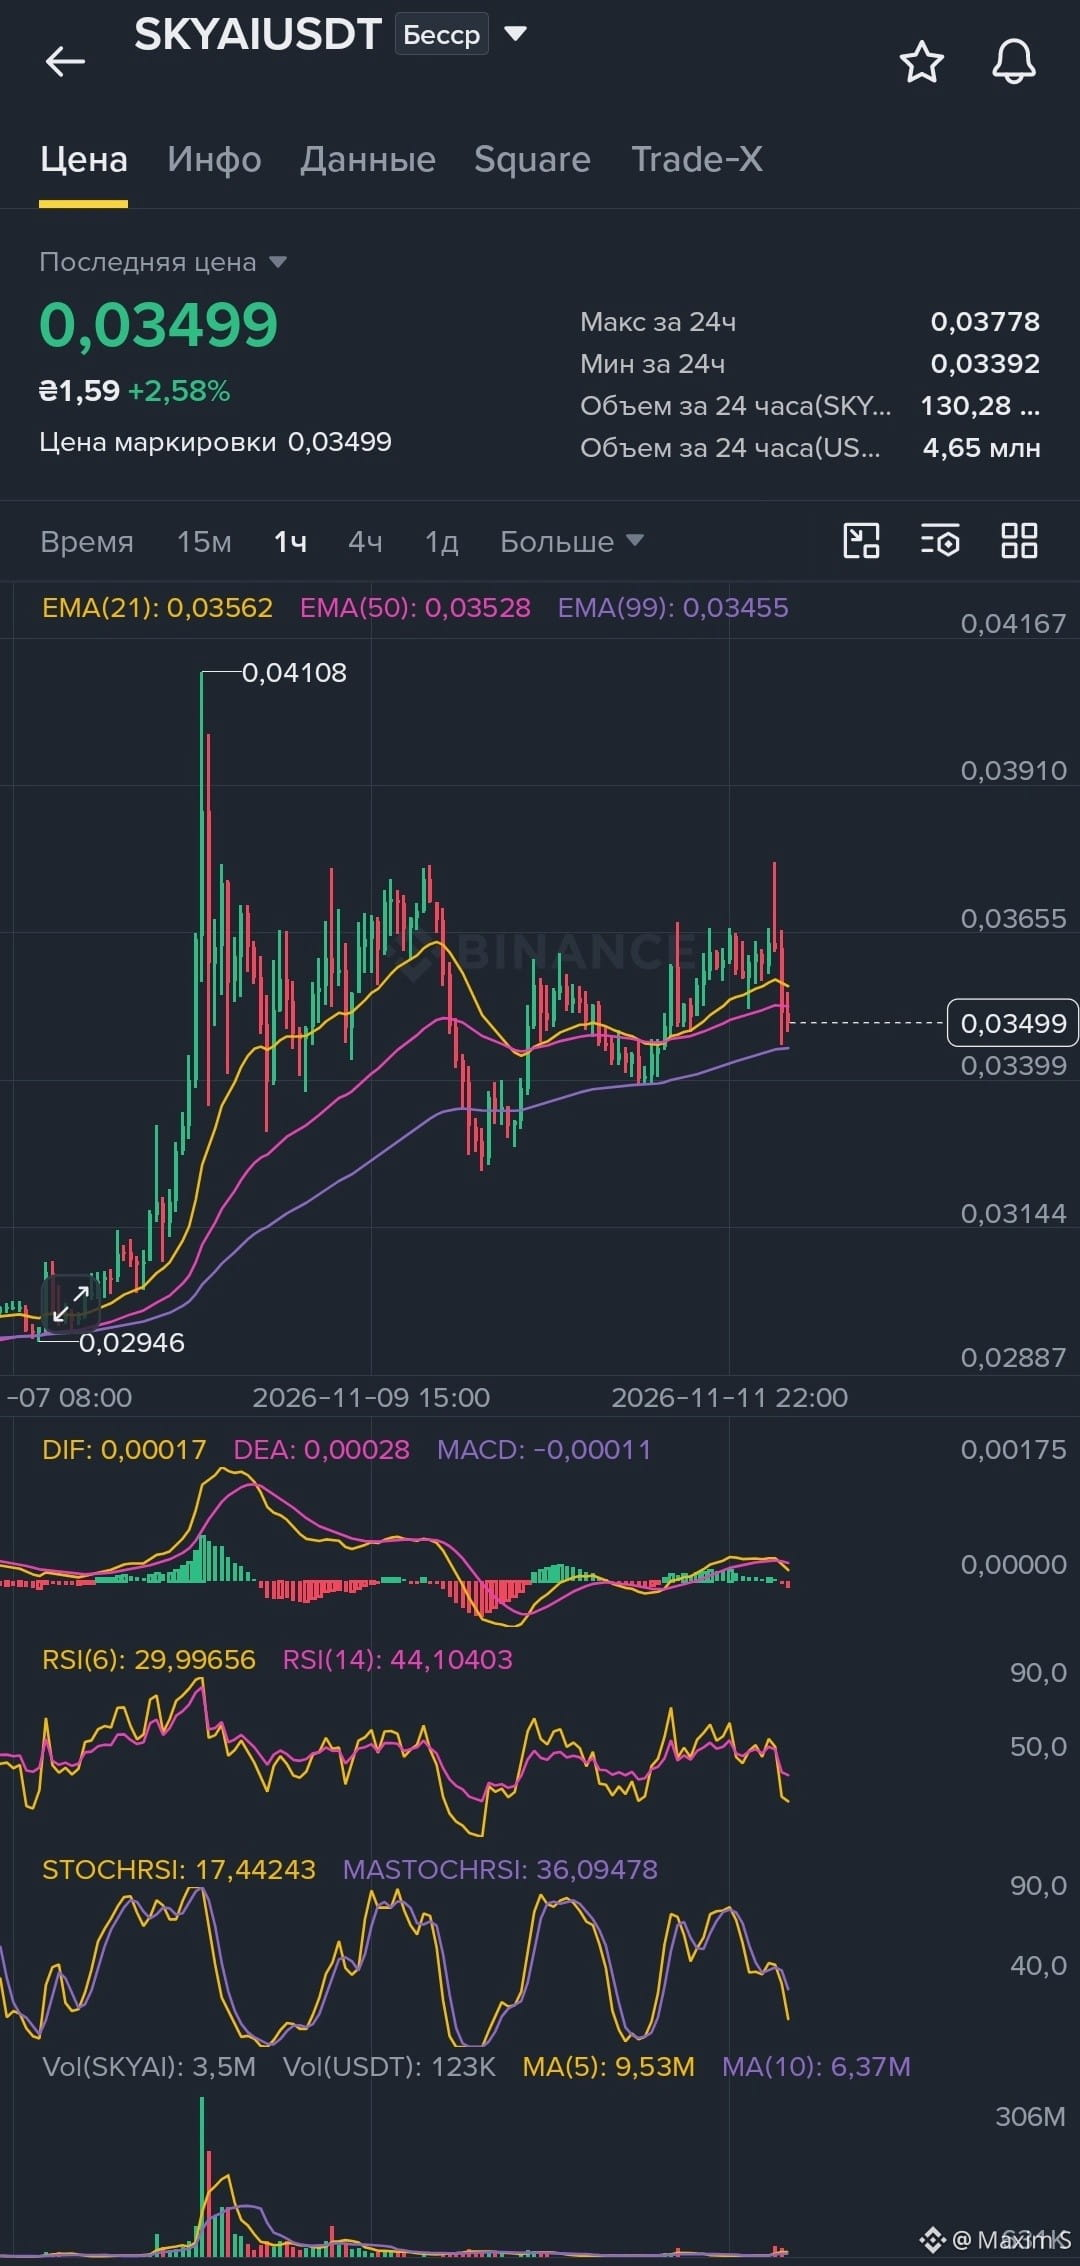
After a powerful move from 0.02946 to 0.04108, the price entered consolidation. We’re now seeing a pullback to EMA99 (0.03455) and the first buyer response from this zone.
What the indicators show:
* RSI(6): 30 / RSI(14): 44 — short-term oversold conditions.
* StochRSI: 17 — the indicator is approaching the oversold zone.
* MACD: the histogram is negative; short-term momentum has weakened.
* Volume: remains low, and selling pressure is gradually fading.
Main scenario — LONG 🚀
An interesting zone to watch is 0.0345–0.0340. If EMA99 holds and buyer confirmation appears, a bounce toward these levels is possible:
🎯 TP1: 0.03530–0.03560
🎯 TP2: 0.03650
🎯 TP3: 0.03770
Scenario invalidation: a close below EMA99 and loss of support at 0.0339.
As long as EMA99 holds, there’s still a chance for the recovery to continue. We’re waiting for momentum confirmation and a return above EMA21/50. 👀
Trading 👉$SKYAI
After a powerful move from 0.02946 to 0.04108, the price entered consolidation. We’re now seeing a pullback to EMA99 (0.03455) and the first buyer response from this zone.
What the indicators show:
* RSI(6): 30 / RSI(14): 44 — short-term oversold conditions.
* StochRSI: 17 — the indicator is approaching the oversold zone.
* MACD: the histogram is negative; short-term momentum has weakened.
* Volume: remains low, and selling pressure is gradually fading.
Main scenario — LONG 🚀
An interesting zone to watch is 0.0345–0.0340. If EMA99 holds and buyer confirmation appears, a bounce toward these levels is possible:
🎯 TP1: 0.03530–0.03560
🎯 TP2: 0.03650
🎯 TP3: 0.03770
Scenario invalidation: a close below EMA99 and loss of support at 0.0339.
As long as EMA99 holds, there’s still a chance for the recovery to continue. We’re waiting for momentum confirmation and a return above EMA21/50. 👀
Trading 👉$SKYAI