$ASTS / $COIN / $XLM 4-hour technical indicators are strengthening in sync. Which has greater breakout potential? 🔥
════════════════════
🔴 $ASTS 4-hour bullish signal
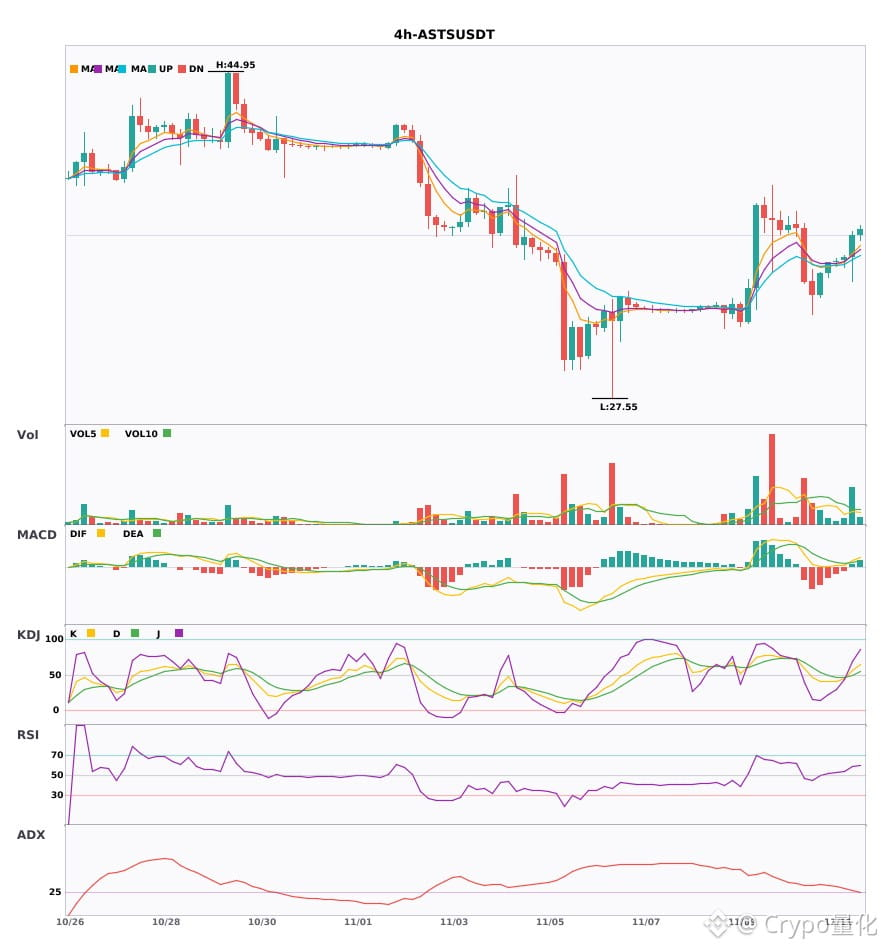
⚠️Technical analysis: ADX(27): A trend is forming; entry is possible | MACD golden cross above zero, bullish momentum emerging | EMA5 crosses above EMA8, short-term outlook turns bullish | KDJ golden cross, bullish short-term outlook (K: 56.1, D: 49.6) | Volume increased (2.5x)
════════════════════
🔴 $COIN 4-hour bullish signal
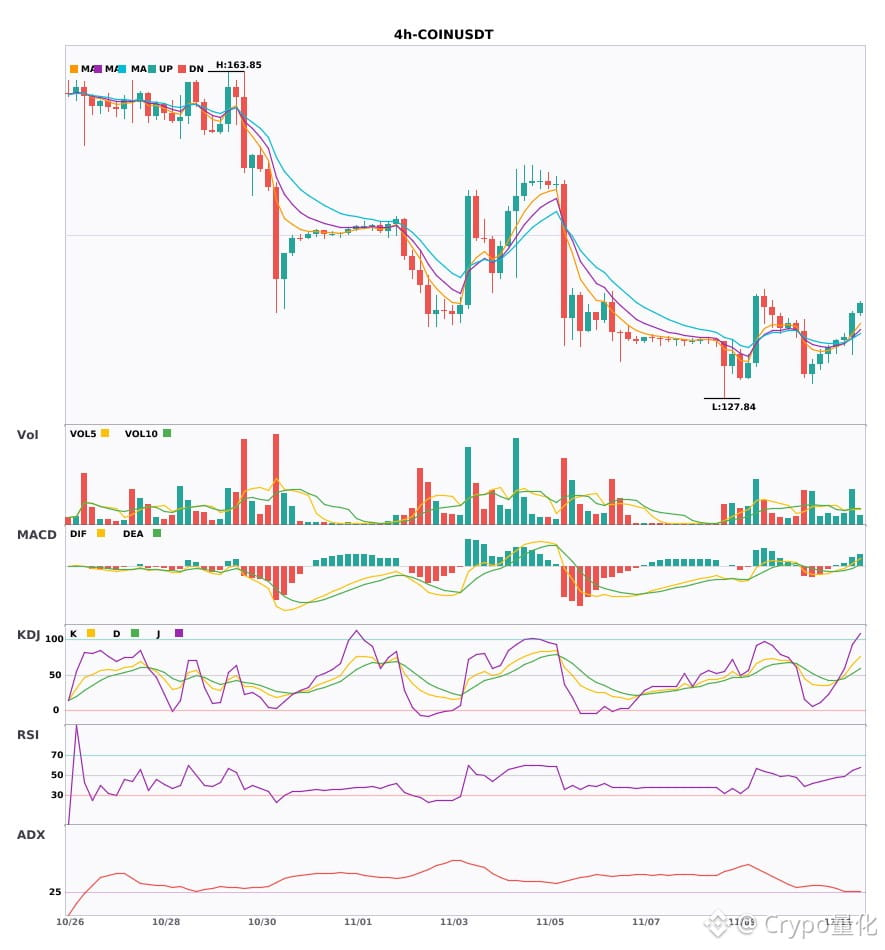
⚠️Technical analysis: ADX(26): A trend is forming; entry is possible | MACD DIF breaks above zero, trend turns bullish | EMA5 > EMA8 > EMA13, bullish alignment | KDJ running strong, bulls in control (K: 65.1, D: 51.4) | Volume increased (2.2x)
════════════════════
🔴 $XLM 4-hour bullish signal
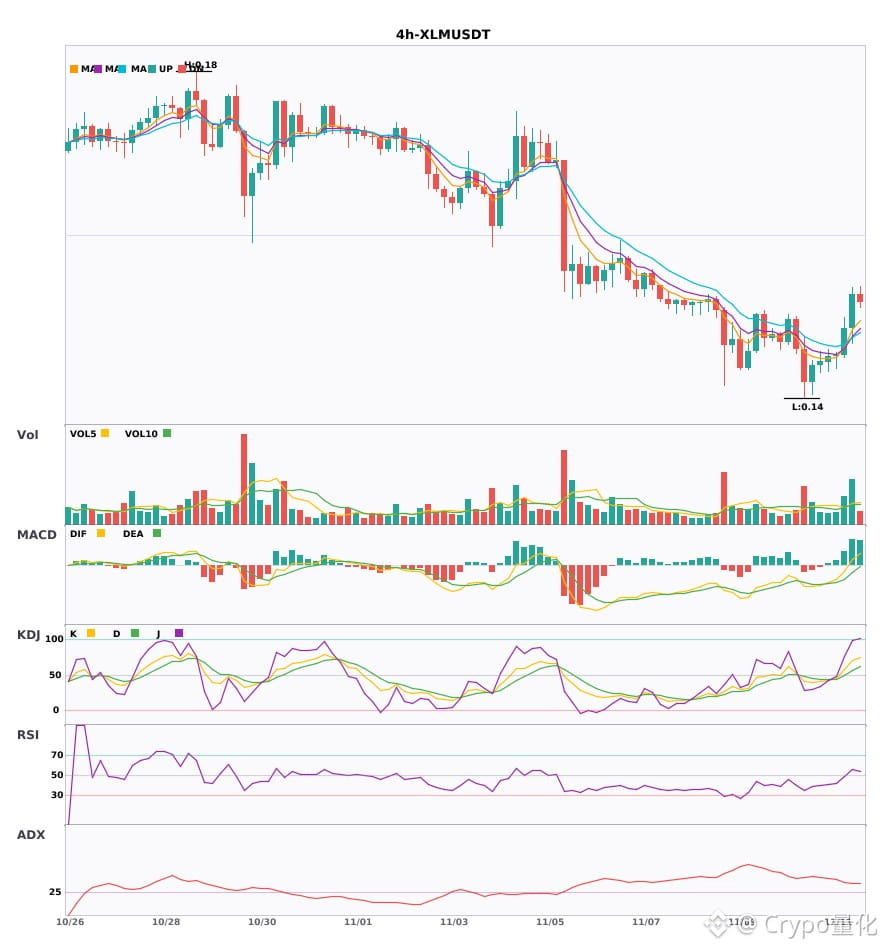
⚠️Technical analysis: ADX(35): A clear trending market | MACD DIF breaks above zero, trend turns bullish | EMA5 > EMA8 > EMA13, bullish alignment | KDJ running strong, bulls in control (K: 69.9, D: 55.8) | Volume increased (2.2x)
════════════════════
🔔 Follow for the latest market movements 🔔
#技术分析 #ASTS #COIN #XLM
📌 When trading, pay attention to whether the candlestick pattern meets your criteria
════════════════════
🔴 $ASTS 4-hour bullish signal
⚠️Technical analysis: ADX(27): A trend is forming; entry is possible | MACD golden cross above zero, bullish momentum emerging | EMA5 crosses above EMA8, short-term outlook turns bullish | KDJ golden cross, bullish short-term outlook (K: 56.1, D: 49.6) | Volume increased (2.5x)
════════════════════
🔴 $COIN 4-hour bullish signal
⚠️Technical analysis: ADX(26): A trend is forming; entry is possible | MACD DIF breaks above zero, trend turns bullish | EMA5 > EMA8 > EMA13, bullish alignment | KDJ running strong, bulls in control (K: 65.1, D: 51.4) | Volume increased (2.2x)
════════════════════
🔴 $XLM 4-hour bullish signal
⚠️Technical analysis: ADX(35): A clear trending market | MACD DIF breaks above zero, trend turns bullish | EMA5 > EMA8 > EMA13, bullish alignment | KDJ running strong, bulls in control (K: 69.9, D: 55.8) | Volume increased (2.2x)
════════════════════
🔔 Follow for the latest market movements 🔔
#技术分析 #ASTS #COIN #XLM
📌 When trading, pay attention to whether the candlestick pattern meets your criteria