Four U.S. stocks, four different reasons for falling. But MIX doesn’t care why they fell.
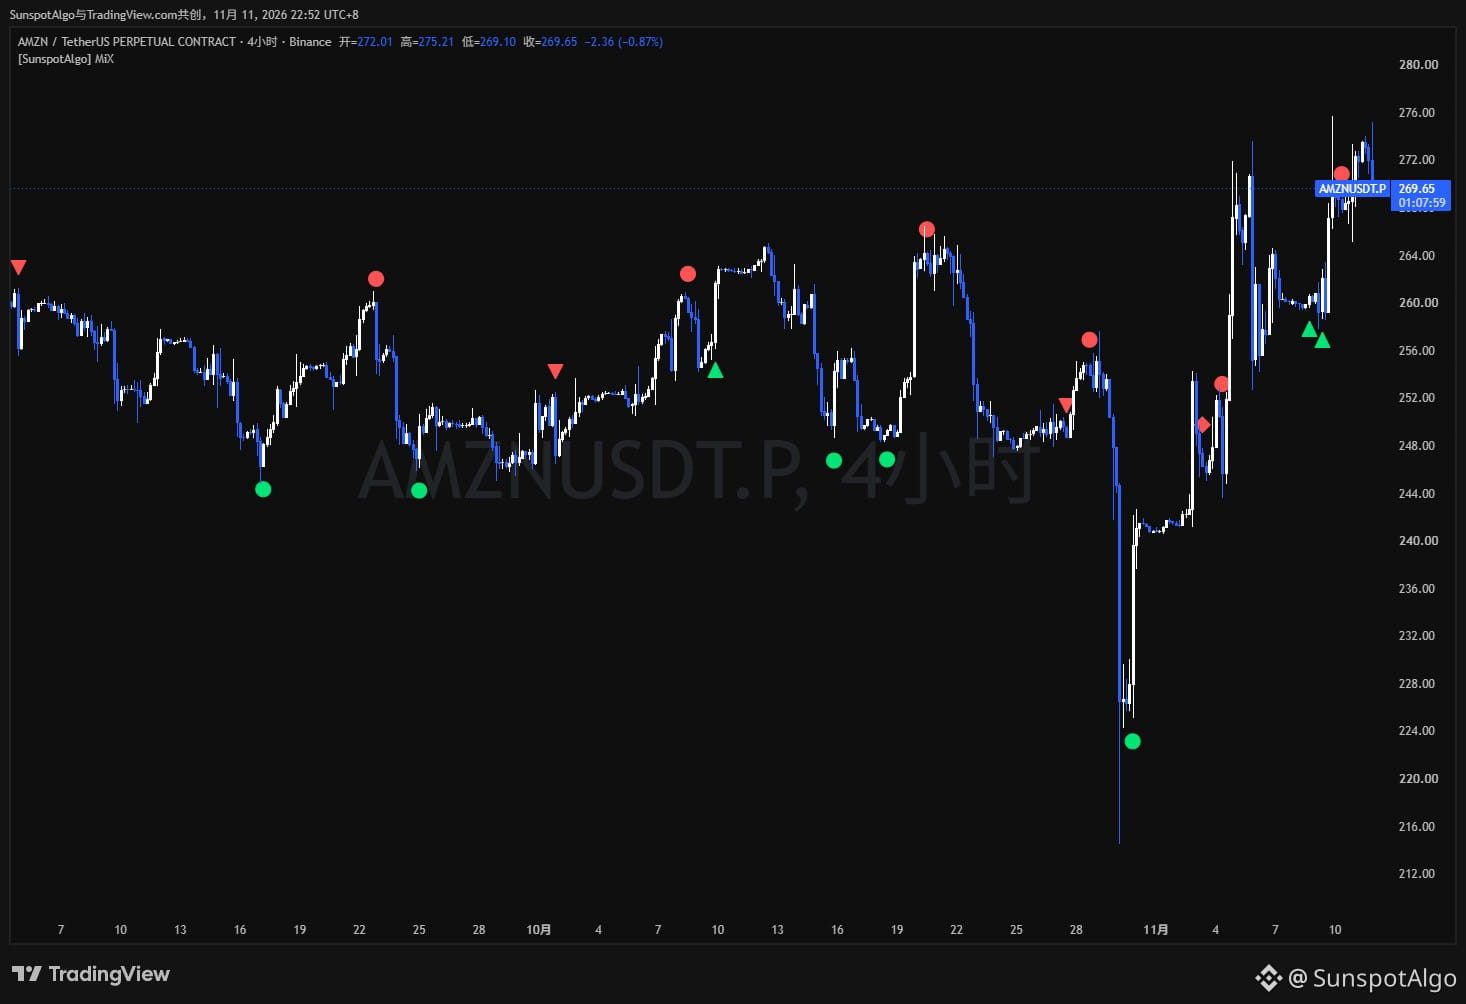
Amazon: Capital expenditures are consuming cash flow
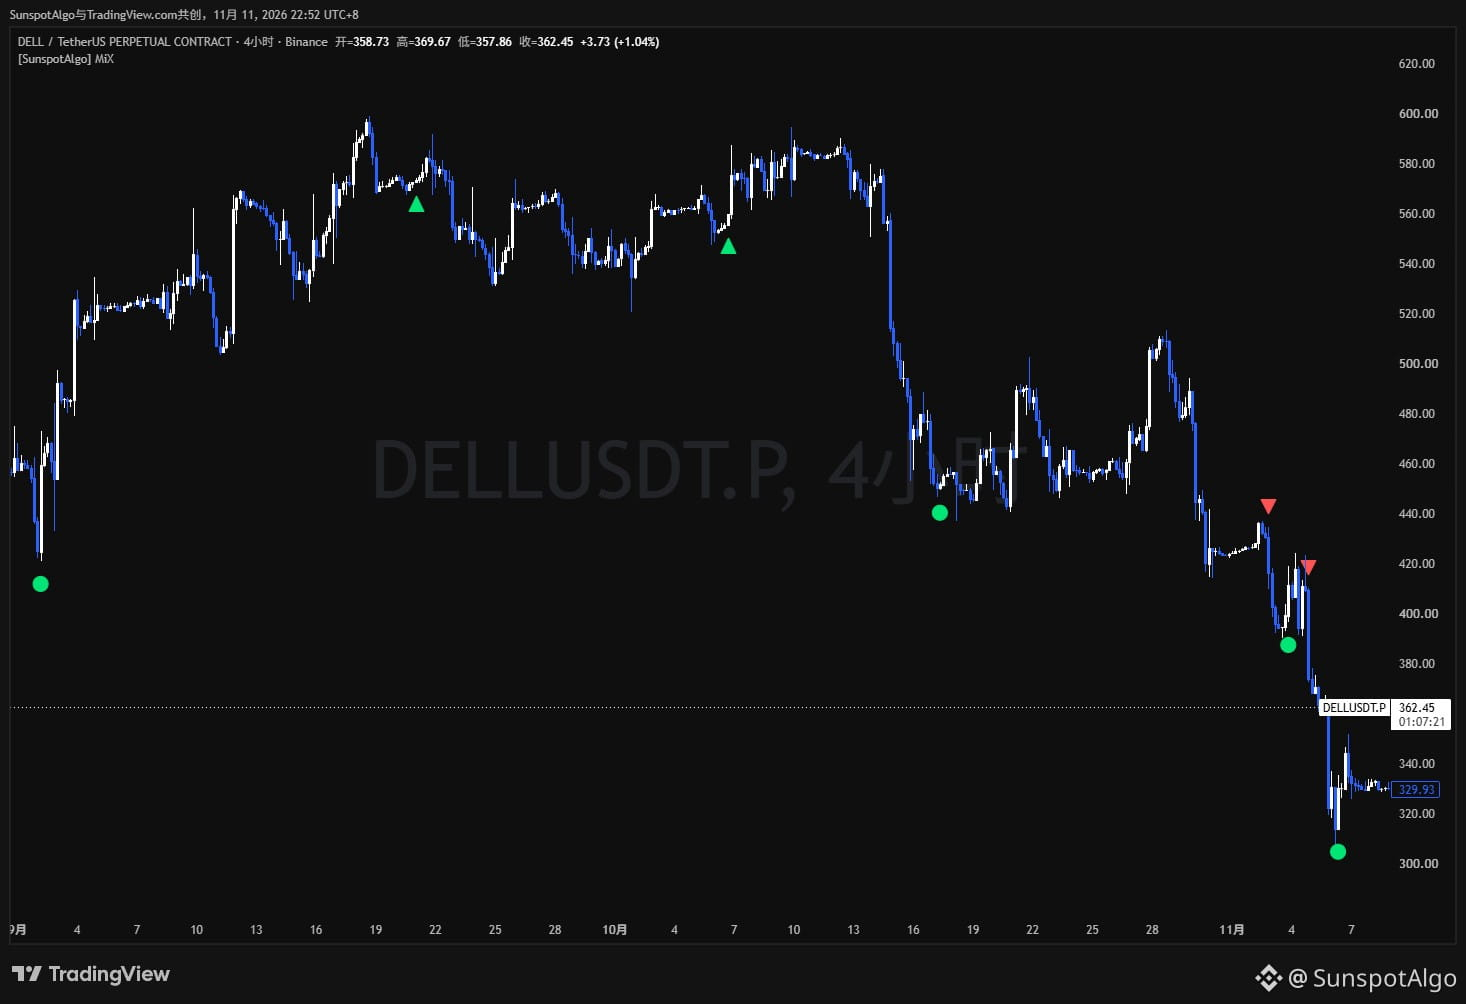
Dell: Record orders, but free cash flow down 47%
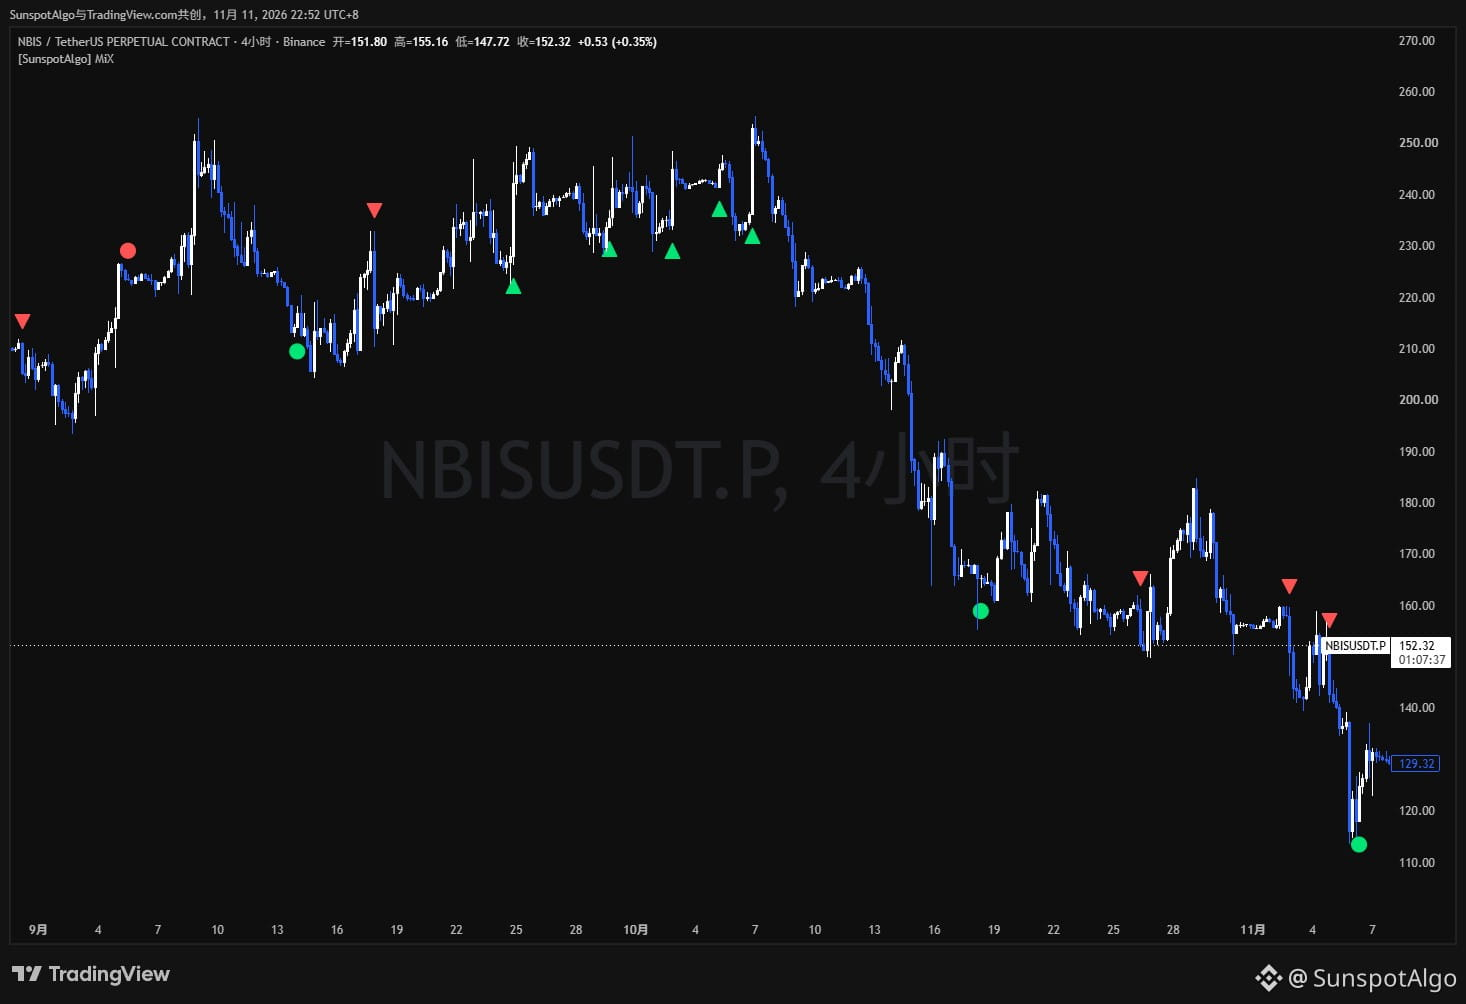
Nebius: The night before earnings
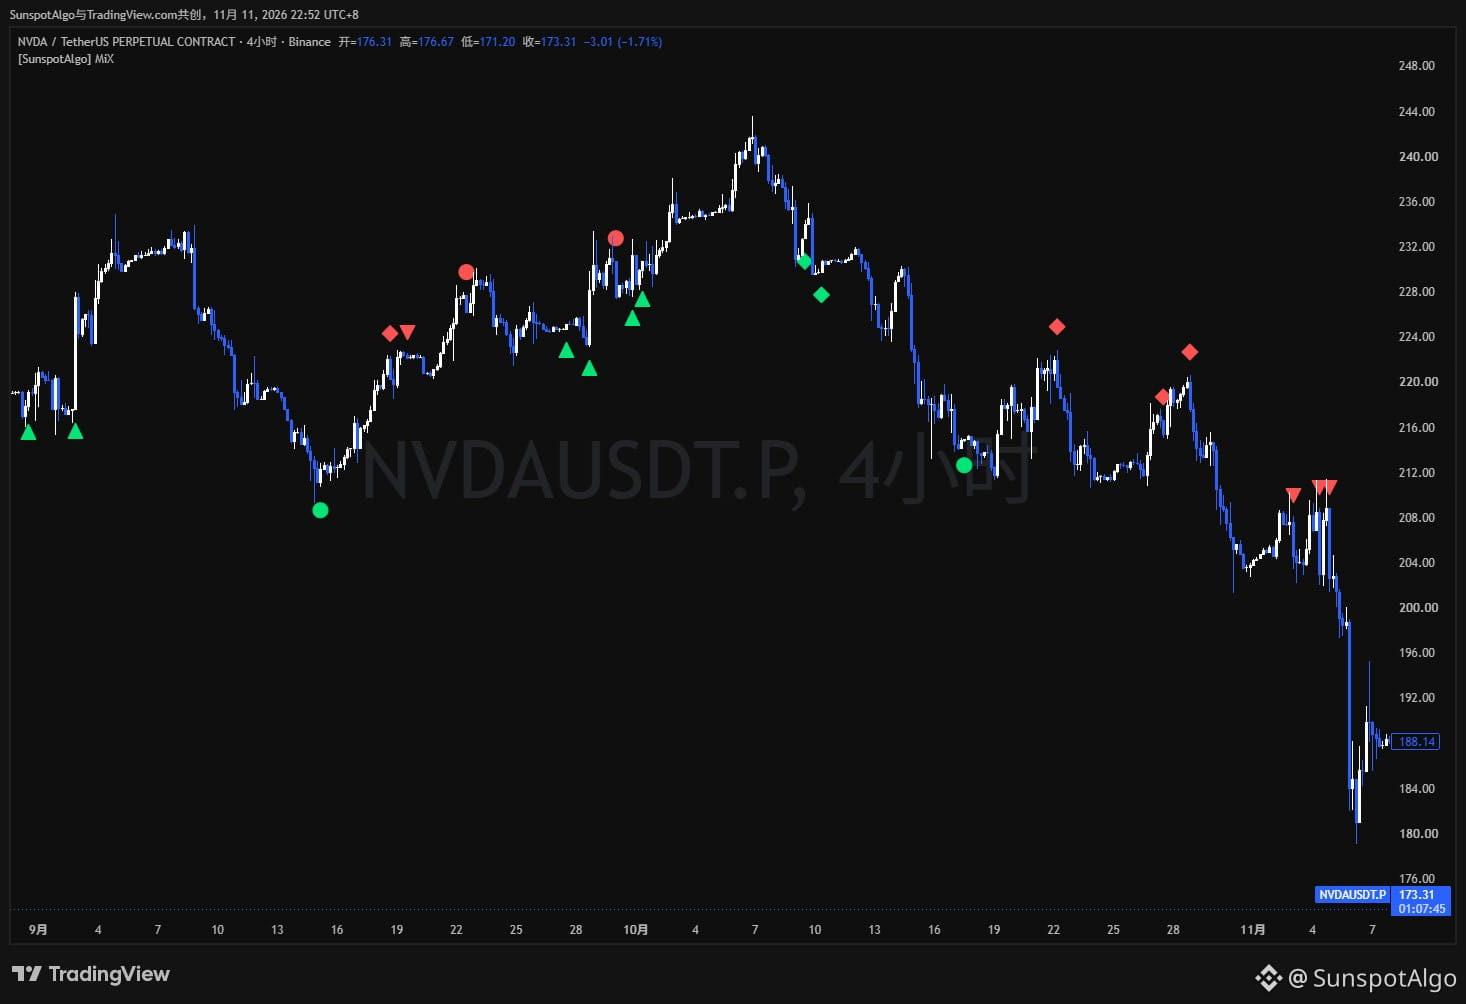
NVIDIA: A letter sparked a market reassessment
Their fundamentals are all different. MIX looks only at price.
This is the result of quantifying years of my technical analysis experience. It doesn’t read earnings reports or chase the news; it only observes market structure, momentum, and price levels.
Below are actual signals for perpetual contracts on four U.S. stocks. Most red signals appeared before declines, while green signals appeared in some cases at the bottom and in others midway through a trend. All four charts are shown as they are, with no cherry-picked perfect examples.
Signals are confirmed and locked in when the candlestick closes. No future data is used, and there is no repainting.
The data comes from U.S. stock perpetual contracts that trade 24/7, not from the underlying stocks. Continuous trading lets the indicator observe price movements after hours and on weekends, but thinly traded periods also carry risks: when liquidity is low, abnormal price spikes can cause sharp volatility. MIX identifies price structure; it does not assess order book liquidity.
MIX applies the same logic across all instruments and timeframes, with no separate parameter tuning for individual assets. When you switch timeframes, only the signal frequency changes.
Win rates and risk-reward ratios can’t be judged from a few screenshots. Put the charts back in the context of the full trend and assess them for yourself.
I usually share MIX’s 4-hour signals, and only post when there’s a signal.
——————————————
Thanks for following. You’re also welcome to share your observations and ideas in the comments. I’ll continue sharing chart records and market observations for everyone’s reference.
Amazon: Capital expenditures are consuming cash flow
Dell: Record orders, but free cash flow down 47%
Nebius: The night before earnings
NVIDIA: A letter sparked a market reassessment
Their fundamentals are all different. MIX looks only at price.
This is the result of quantifying years of my technical analysis experience. It doesn’t read earnings reports or chase the news; it only observes market structure, momentum, and price levels.
Below are actual signals for perpetual contracts on four U.S. stocks. Most red signals appeared before declines, while green signals appeared in some cases at the bottom and in others midway through a trend. All four charts are shown as they are, with no cherry-picked perfect examples.
Signals are confirmed and locked in when the candlestick closes. No future data is used, and there is no repainting.
The data comes from U.S. stock perpetual contracts that trade 24/7, not from the underlying stocks. Continuous trading lets the indicator observe price movements after hours and on weekends, but thinly traded periods also carry risks: when liquidity is low, abnormal price spikes can cause sharp volatility. MIX identifies price structure; it does not assess order book liquidity.
MIX applies the same logic across all instruments and timeframes, with no separate parameter tuning for individual assets. When you switch timeframes, only the signal frequency changes.
Win rates and risk-reward ratios can’t be judged from a few screenshots. Put the charts back in the context of the full trend and assess them for yourself.
I usually share MIX’s 4-hour signals, and only post when there’s a signal.
——————————————
Thanks for following. You’re also welcome to share your observations and ideas in the comments. I’ll continue sharing chart records and market observations for everyone’s reference.