Today's takeaway: All 4 coins are in bearish daily structures; all are also leaning bearish on the 1H, so the short-term and broader trends are aligned. Volatility is very low today (each coin's intraday range is only 31%–44% of its usual level).
EMA Structure Daily Report|2026-11-11 21:02 Beijing Time
Binance USDT perpetuals|Based on the structure panel formula
Structure only; not a complete engine entry signal.
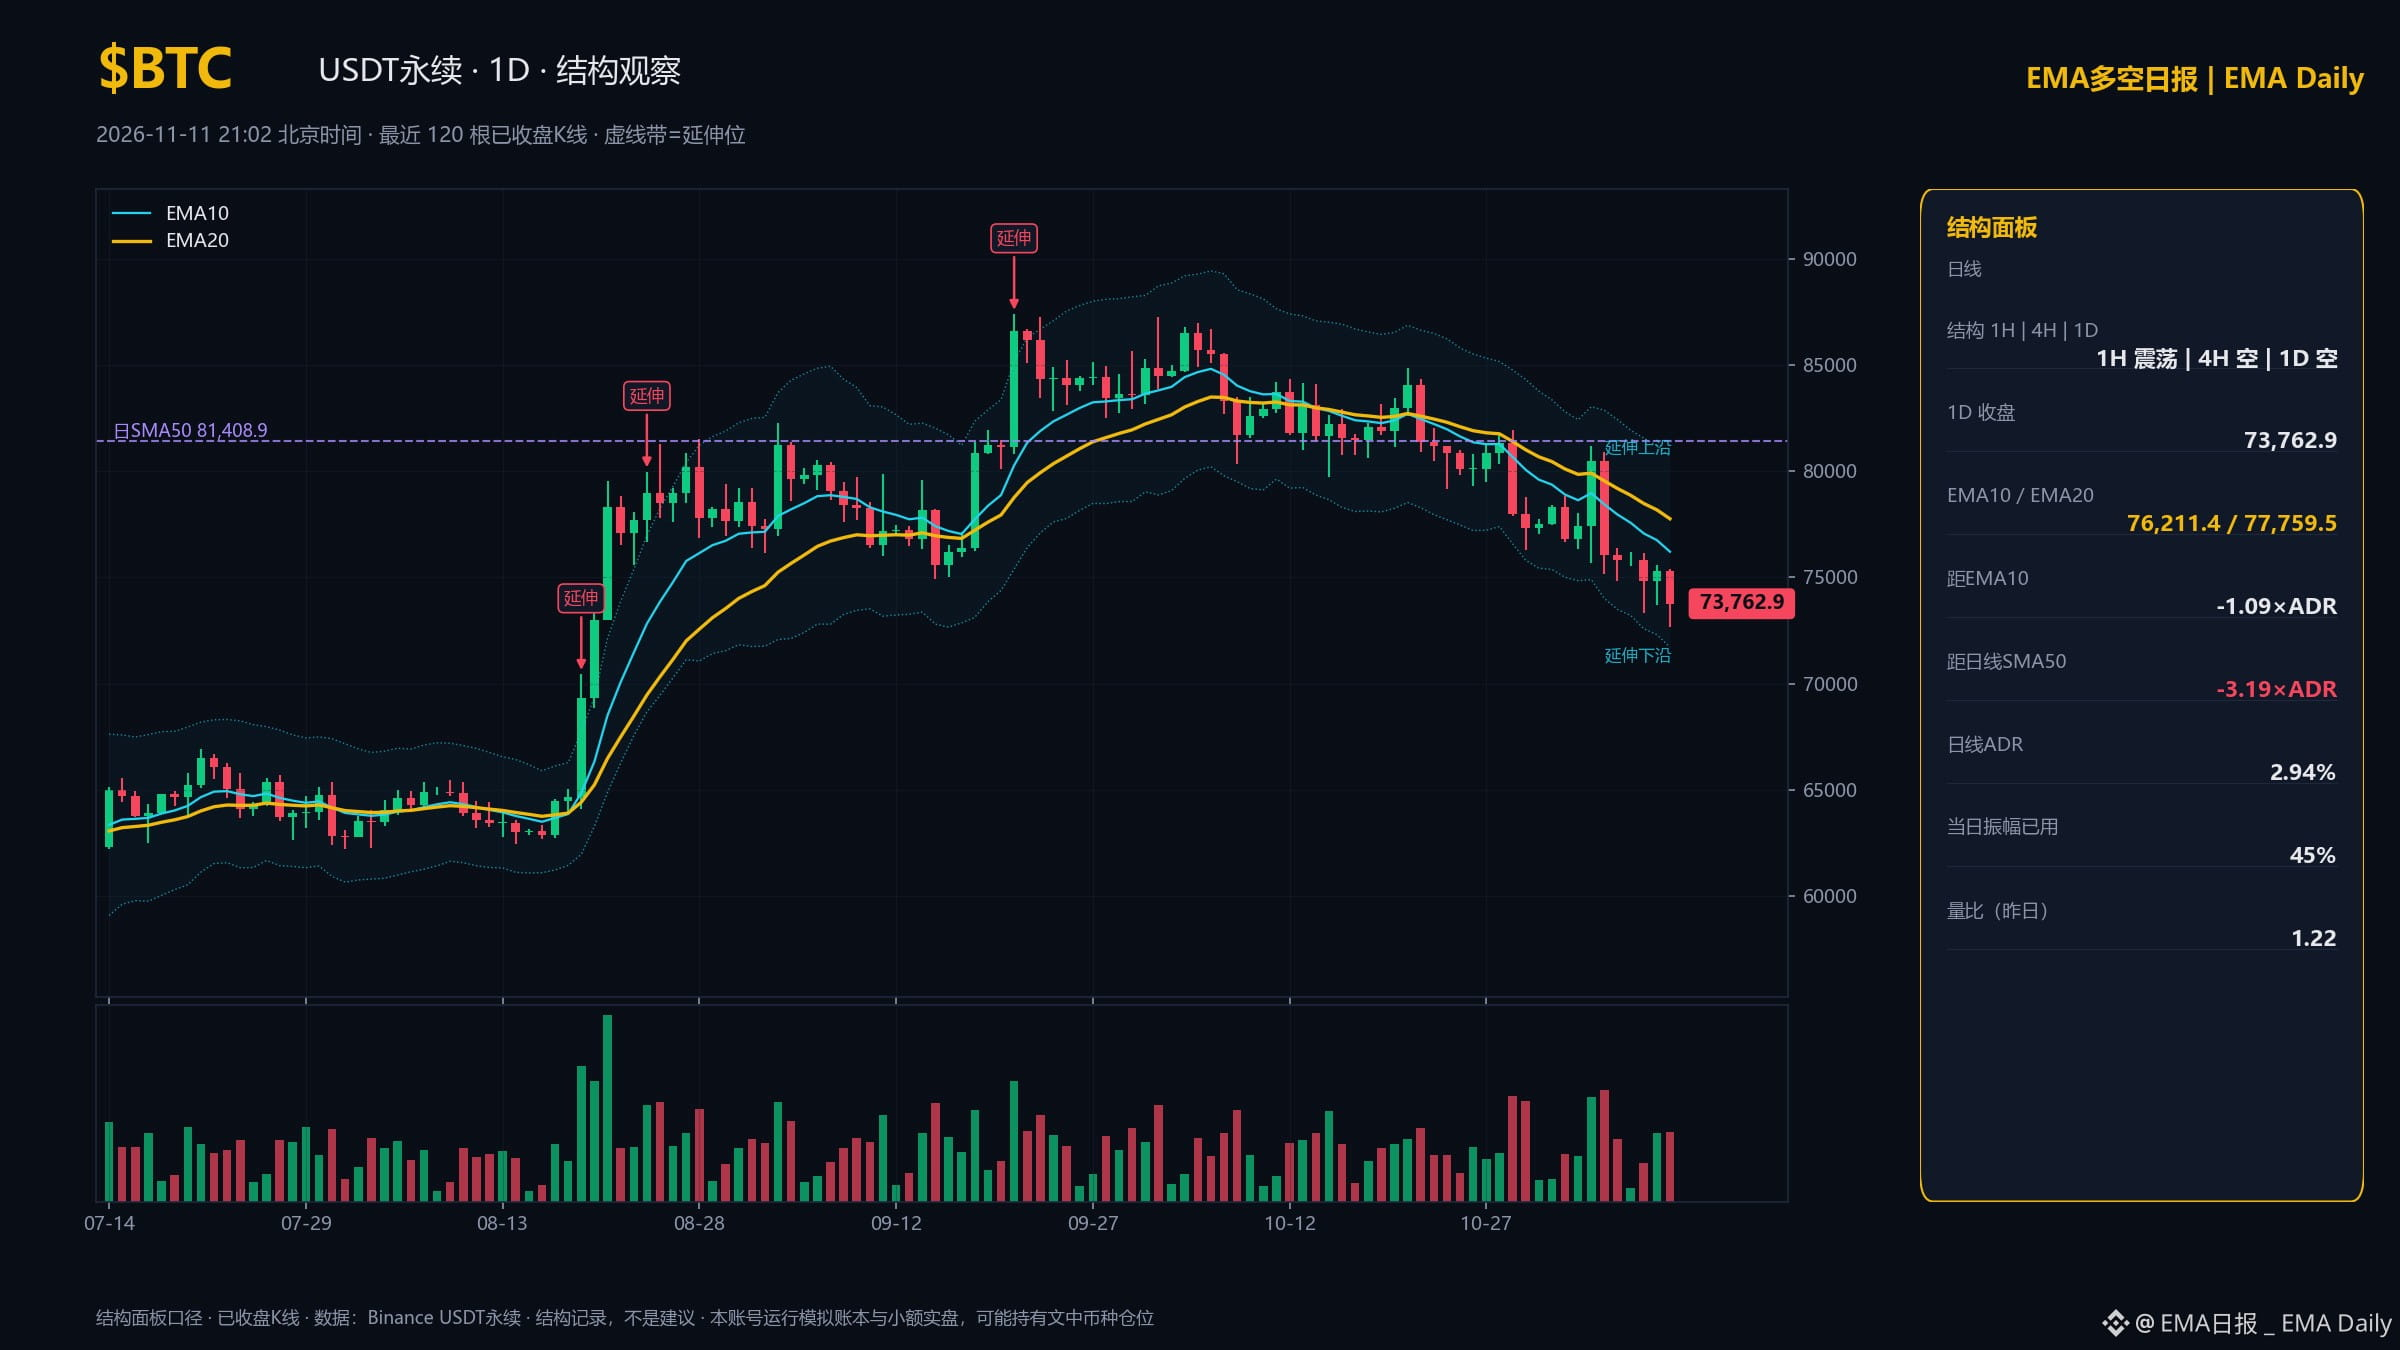
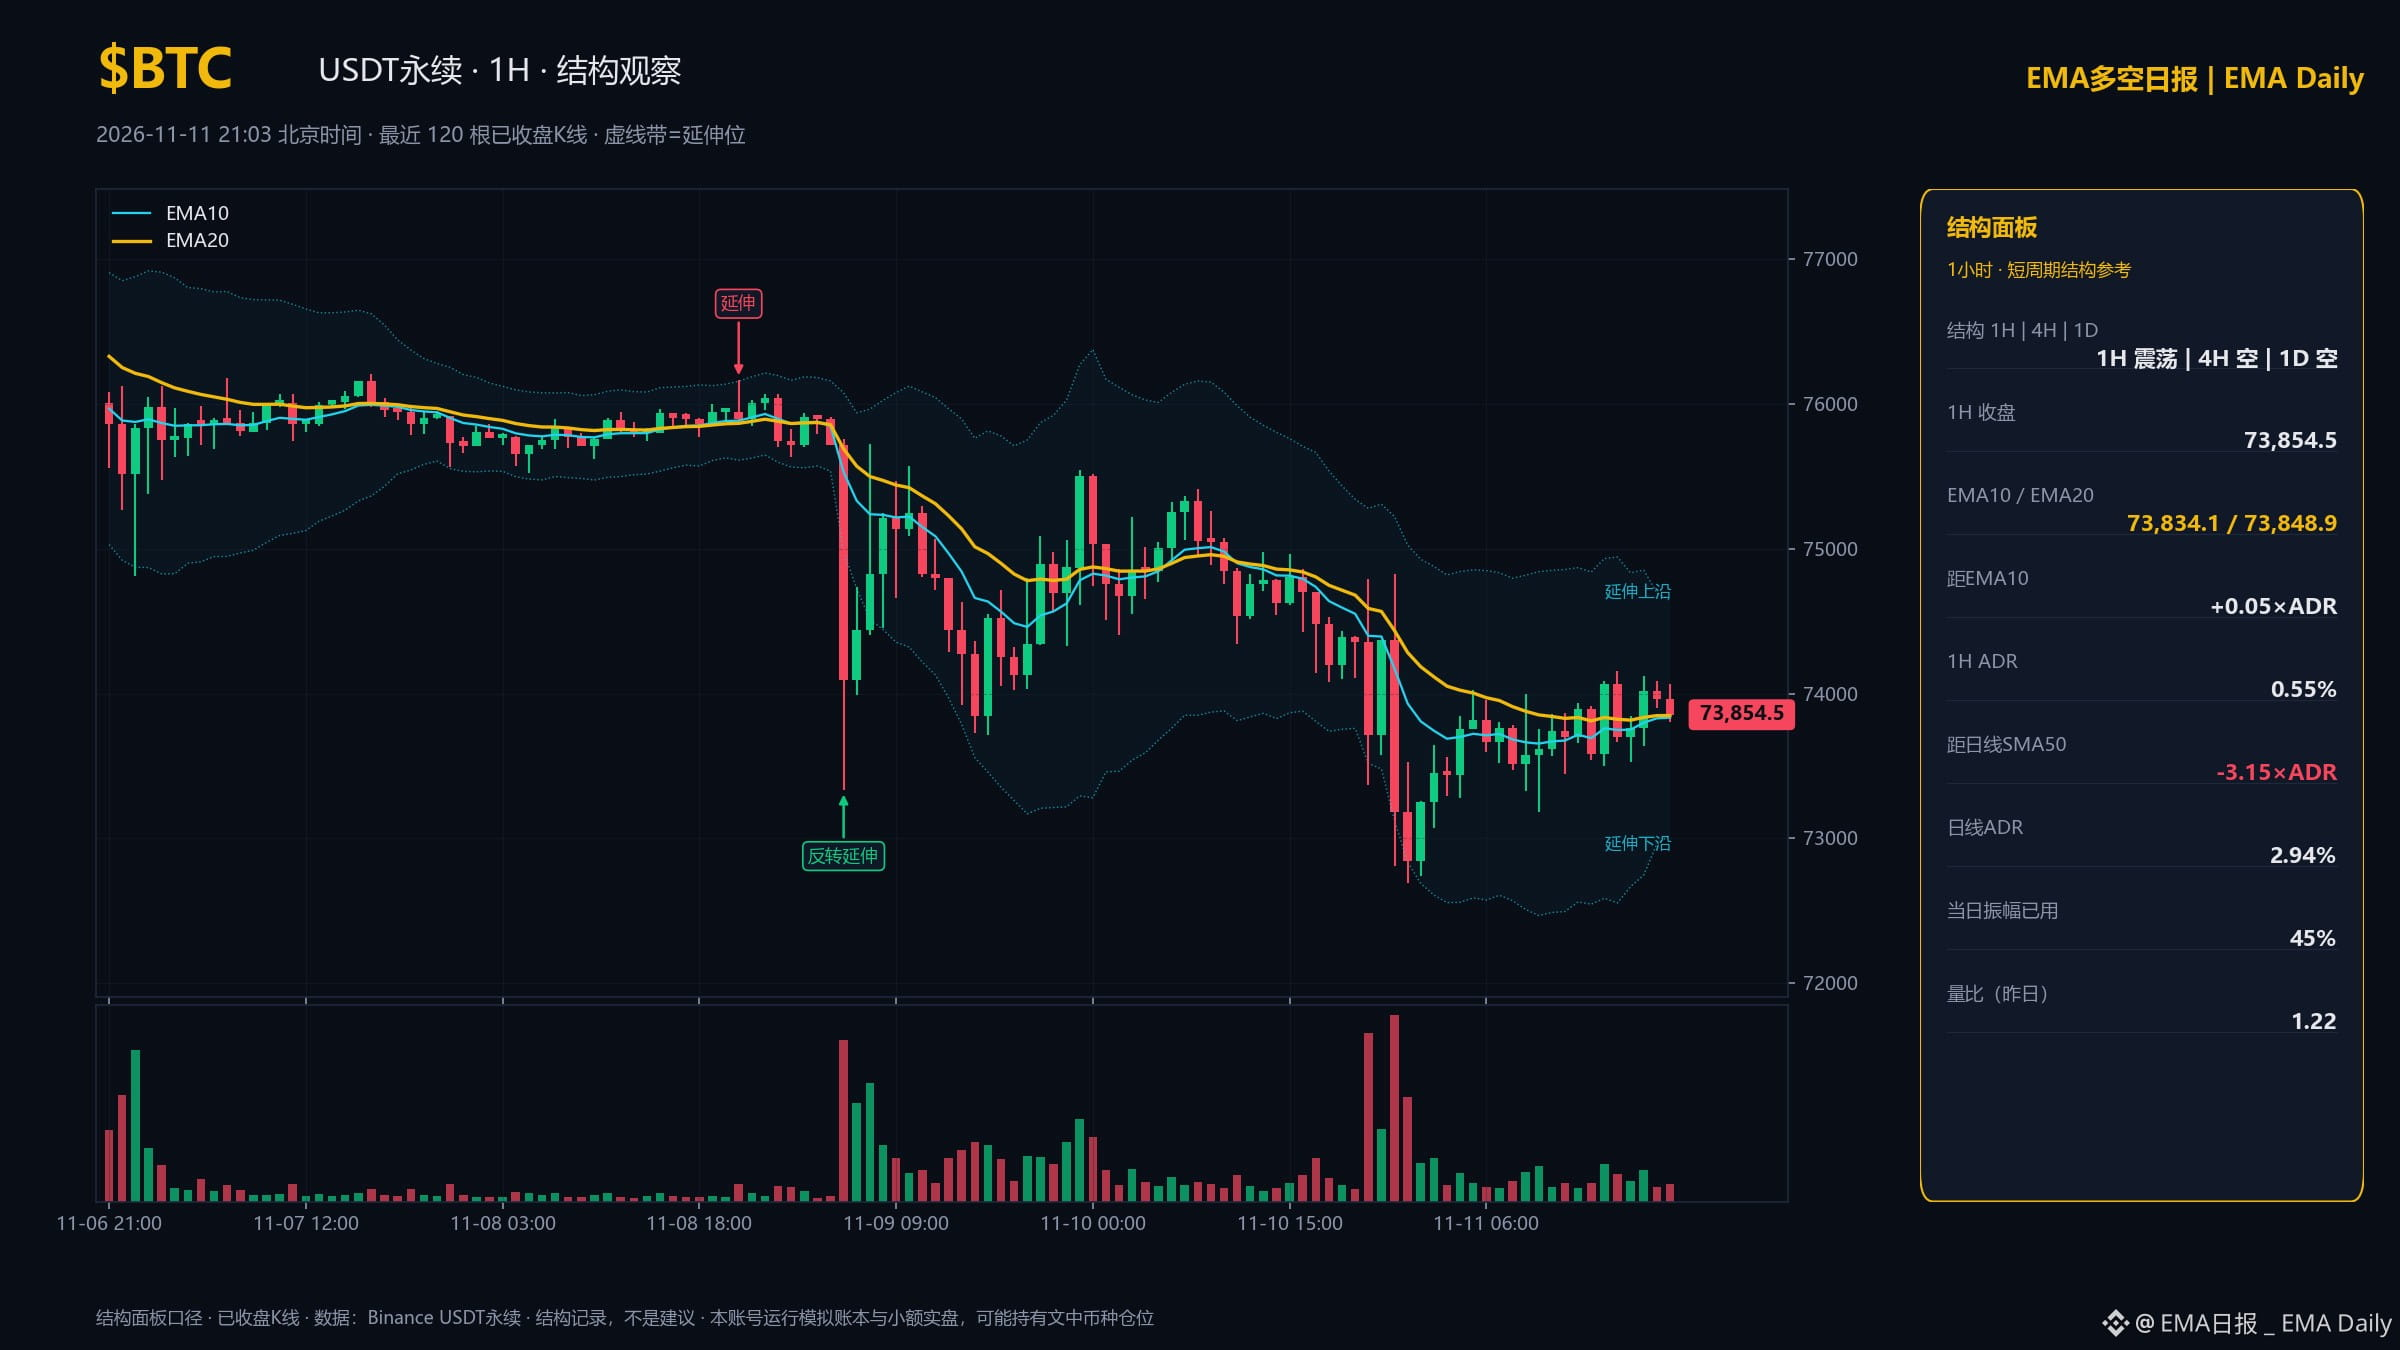
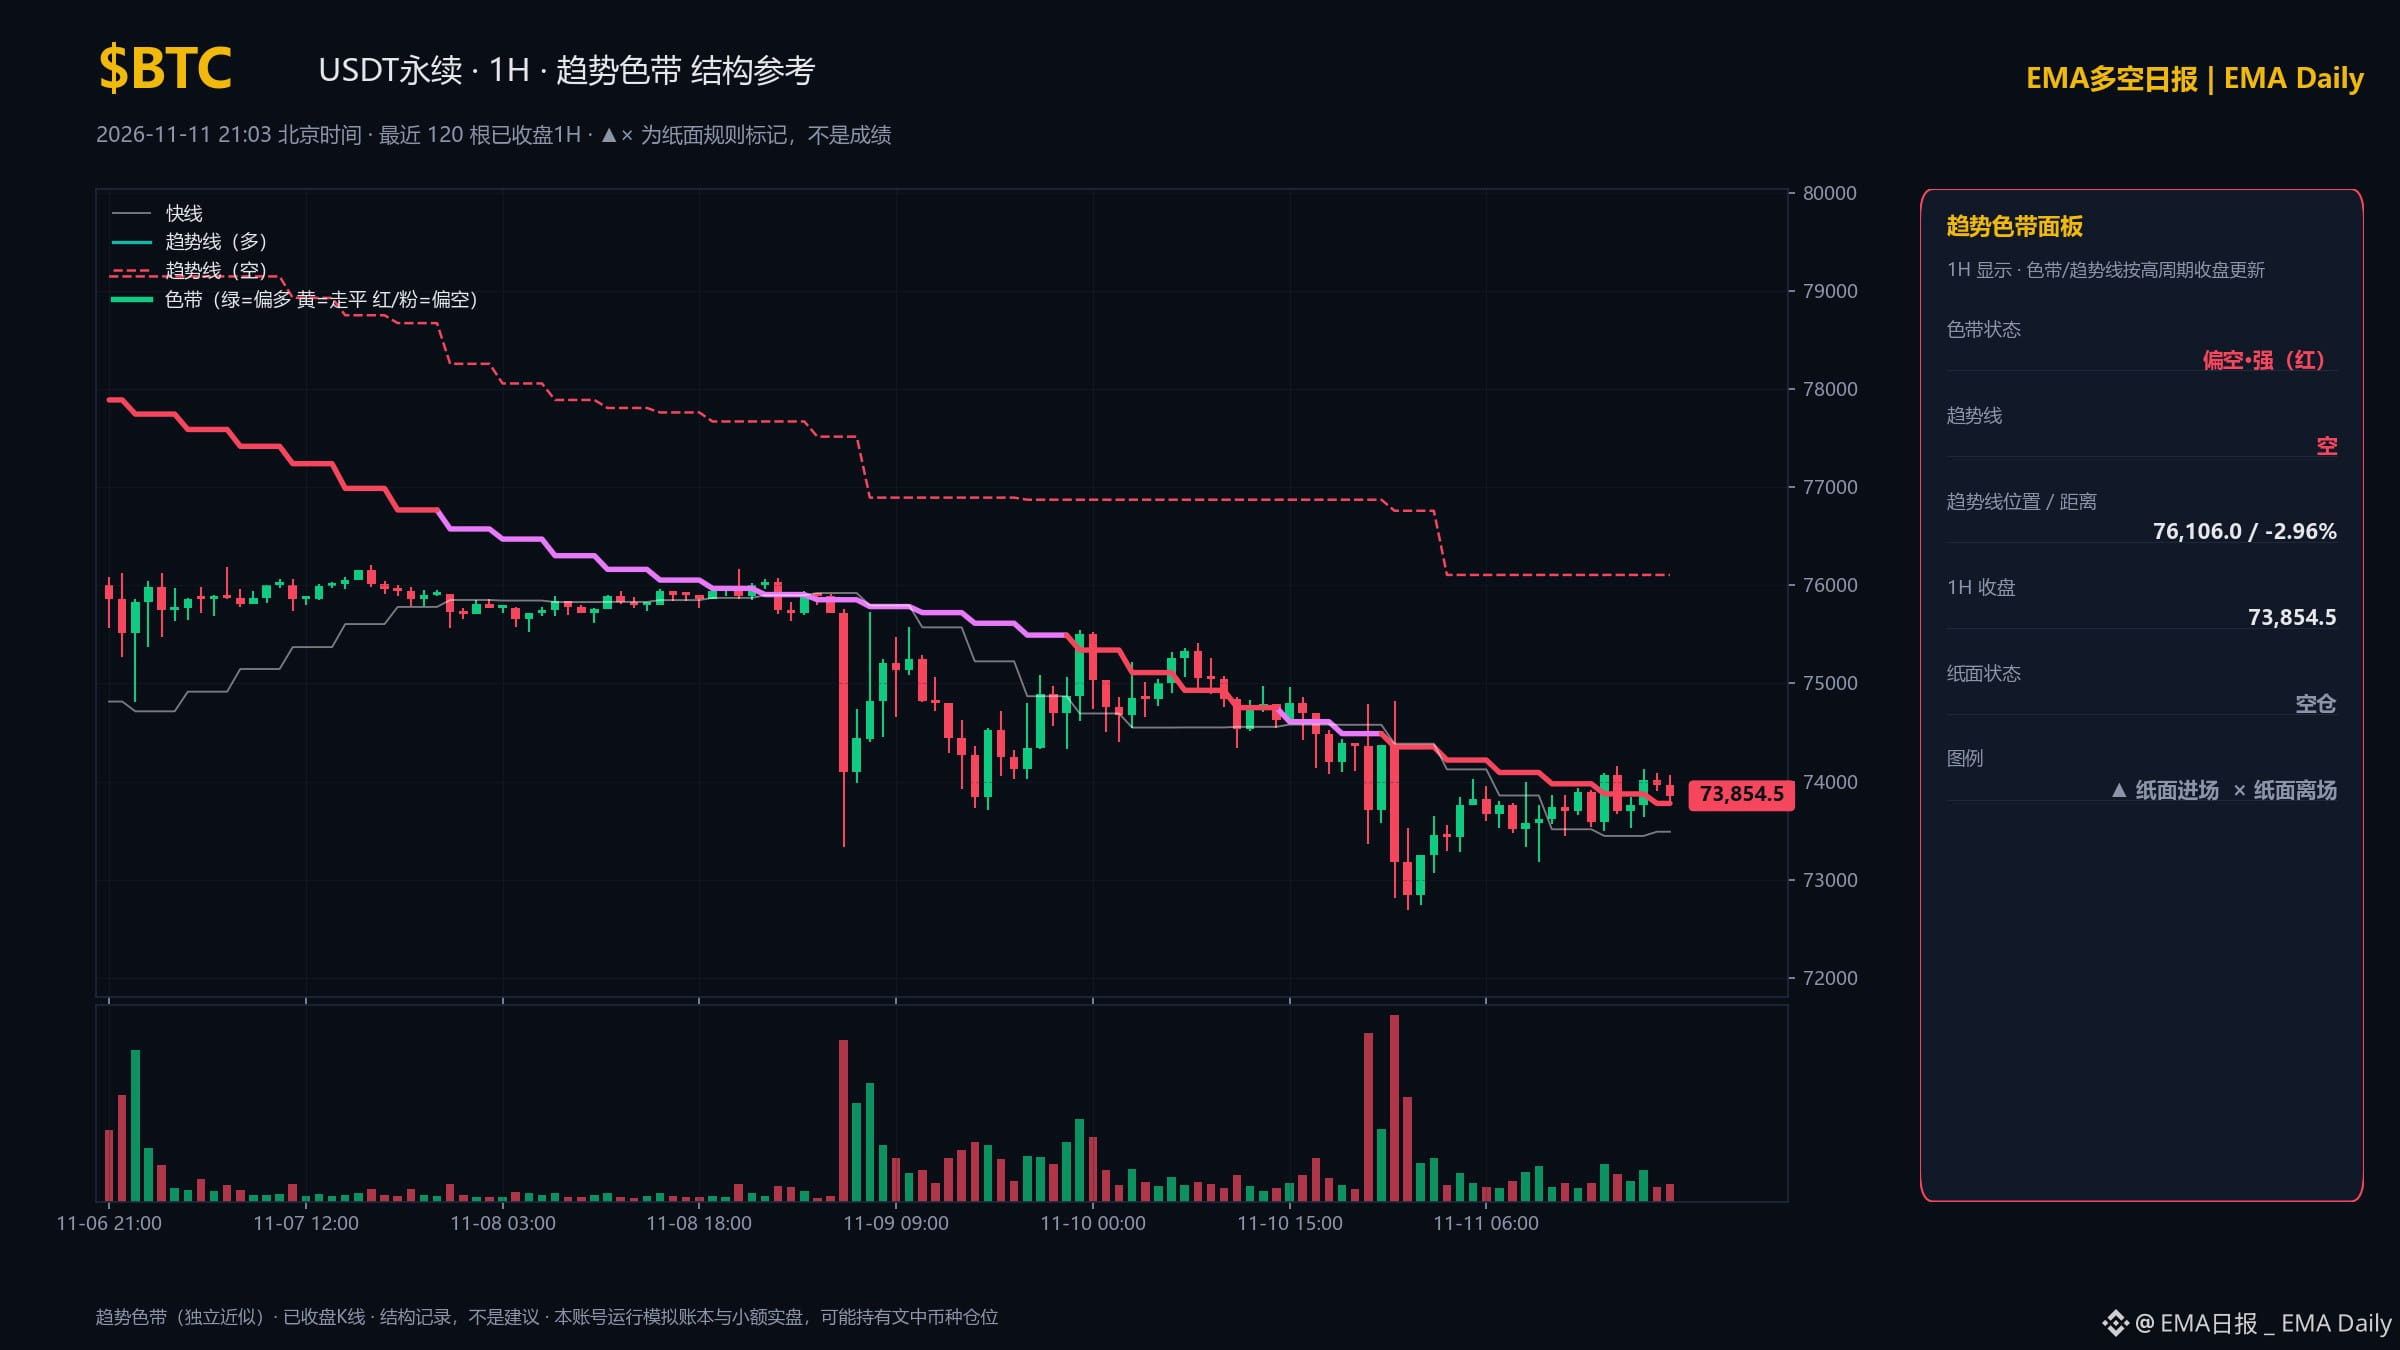
$BTC|1H bearish|4H bearish|Daily bearish
1H close 73854.5; 4H EMA20 74600.4
Daily ADR 2.94%|Volume ratio 1.21
Daily distance from SMA50: -3.19×ADR; upper extension reference 80699.3
Today's range / average range over the previous 20 days: 42.3%
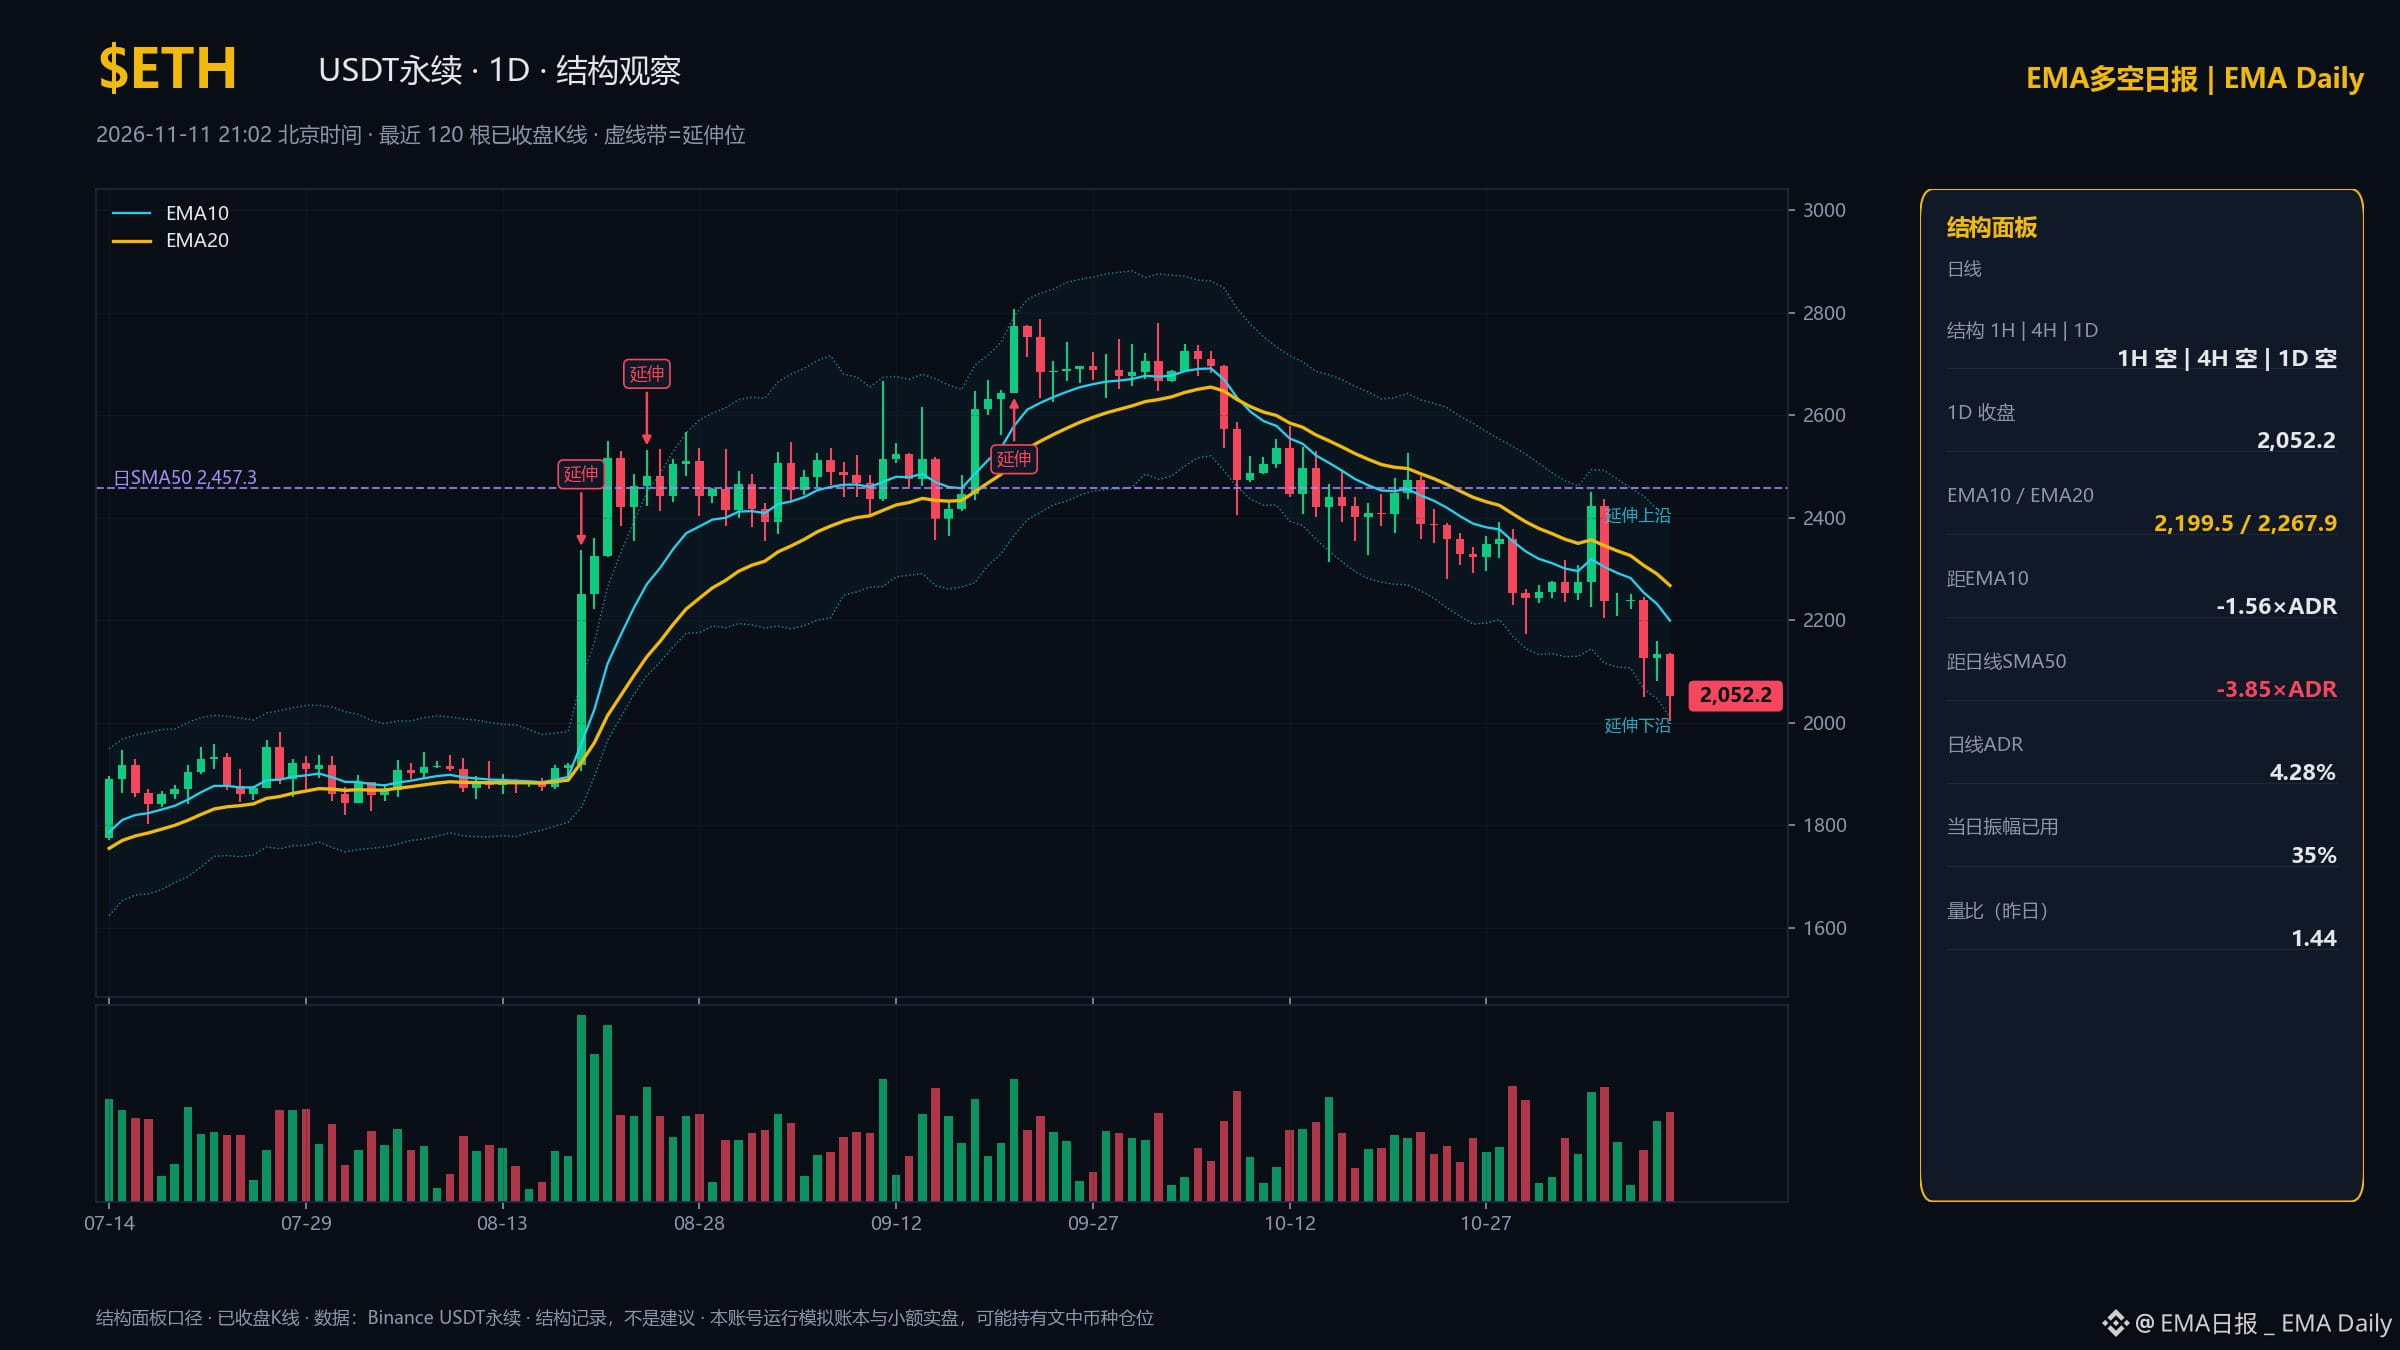
$ETH|1H bearish|4H bearish|Daily bearish
1H close 2052.5; 4H EMA20 2115.9
Daily ADR 4.28%|Volume ratio 1.41
Daily distance from SMA50: -3.85×ADR; upper extension reference 2387.8
Today's range / average range over the previous 20 days: 31.5%
Daily price is below SMA50/200
$SOL|1H bearish|4H bearish|Daily bearish
1H close 83.89; 4H EMA20 85.706
Daily ADR 4.64%|Volume ratio 1.37
Daily distance from SMA50: -4.62×ADR; upper extension reference 98.079
Today's range / average range over the previous 20 days: 43.9%
Daily price is below SMA50/200
BNB|1H bearish|4H bearish|Daily bearish
1H close 681.68; 4H EMA20 686.86
Daily ADR 3.46%|Volume ratio 0.73
Daily distance from SMA50: -2.31×ADR; upper extension reference 745.08
Today's range / average range over the previous 20 days: 33.0%
Data as of the latest closes (Beijing Time): 1H 11-11 21:00; 4H 11-11 20:00; Daily 11-11 08:00
Methodology: EMA10>EMA20 is bullish; otherwise classified as bearish according to the original panel. This does not constitute entry authorization. Daily ADR is the average recent range and includes the last completed daily candle; the daily volume ratio likewise uses completed daily data.
Today's range accumulates only completed 1H candles; the UTC day starts at 08:00 Beijing Time. The range ratio can exceed 100%; this does not indicate remaining upside or downside. Extension reference levels do not mean an exhaustion event has been triggered, and moving averages are not guaranteed support or resistance.
Charts: BTC/ETH daily structure charts; BTC 1H structure chart and 1H trend ribbon chart. Dashed bands indicate extension levels; panel figures are based on completed candles.
BTC is bearish across 1H/4H/daily, and still has some distance to go before reaching the daily SMA50 (81408.9). What do you think are the odds of it first reclaiming 73848.9 (1H EMA20) this week?
#EMA #MarketWatch
Not investment advice.
EMA Structure Daily Report|2026-11-11 21:02 Beijing Time
Binance USDT perpetuals|Based on the structure panel formula
Structure only; not a complete engine entry signal.
$BTC|1H bearish|4H bearish|Daily bearish
1H close 73854.5; 4H EMA20 74600.4
Daily ADR 2.94%|Volume ratio 1.21
Daily distance from SMA50: -3.19×ADR; upper extension reference 80699.3
Today's range / average range over the previous 20 days: 42.3%
$ETH|1H bearish|4H bearish|Daily bearish
1H close 2052.5; 4H EMA20 2115.9
Daily ADR 4.28%|Volume ratio 1.41
Daily distance from SMA50: -3.85×ADR; upper extension reference 2387.8
Today's range / average range over the previous 20 days: 31.5%
Daily price is below SMA50/200
$SOL|1H bearish|4H bearish|Daily bearish
1H close 83.89; 4H EMA20 85.706
Daily ADR 4.64%|Volume ratio 1.37
Daily distance from SMA50: -4.62×ADR; upper extension reference 98.079
Today's range / average range over the previous 20 days: 43.9%
Daily price is below SMA50/200
BNB|1H bearish|4H bearish|Daily bearish
1H close 681.68; 4H EMA20 686.86
Daily ADR 3.46%|Volume ratio 0.73
Daily distance from SMA50: -2.31×ADR; upper extension reference 745.08
Today's range / average range over the previous 20 days: 33.0%
Data as of the latest closes (Beijing Time): 1H 11-11 21:00; 4H 11-11 20:00; Daily 11-11 08:00
Methodology: EMA10>EMA20 is bullish; otherwise classified as bearish according to the original panel. This does not constitute entry authorization. Daily ADR is the average recent range and includes the last completed daily candle; the daily volume ratio likewise uses completed daily data.
Today's range accumulates only completed 1H candles; the UTC day starts at 08:00 Beijing Time. The range ratio can exceed 100%; this does not indicate remaining upside or downside. Extension reference levels do not mean an exhaustion event has been triggered, and moving averages are not guaranteed support or resistance.
Charts: BTC/ETH daily structure charts; BTC 1H structure chart and 1H trend ribbon chart. Dashed bands indicate extension levels; panel figures are based on completed candles.
BTC is bearish across 1H/4H/daily, and still has some distance to go before reaching the daily SMA50 (81408.9). What do you think are the odds of it first reclaiming 73848.9 (1H EMA20) this week?
#EMA #MarketWatch
Not investment advice.