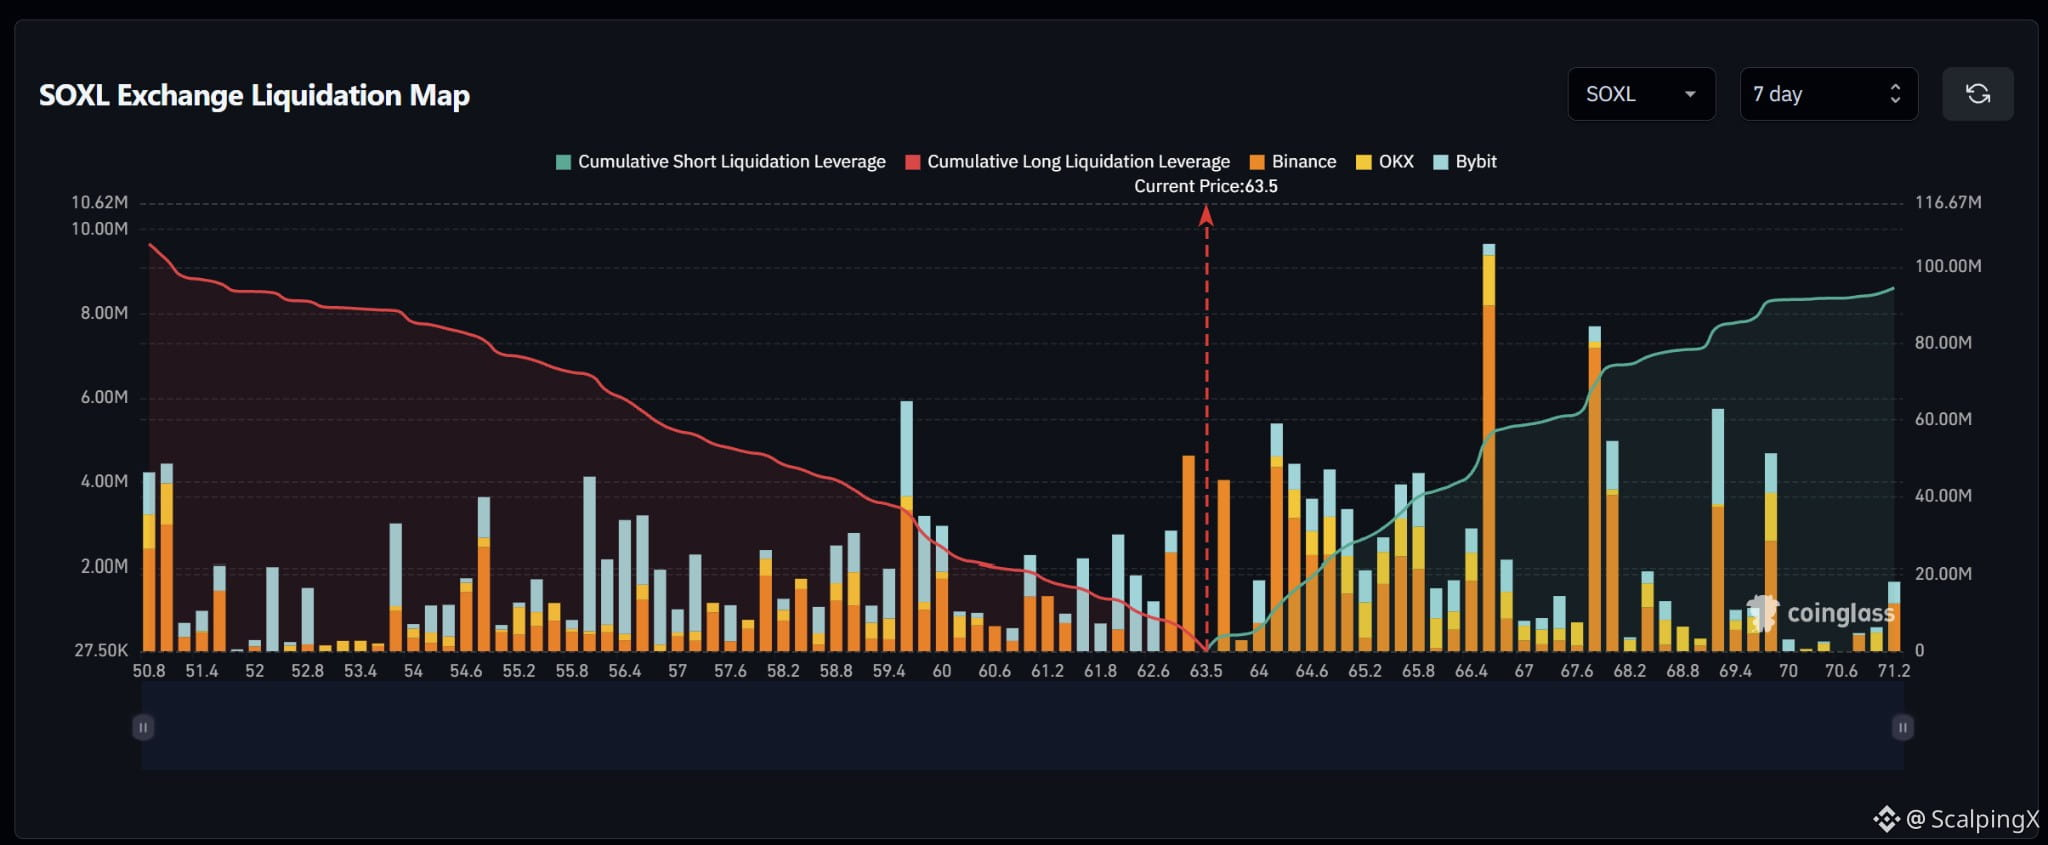
$SOXL – Liquidation Map (7 days) – Index ~63.5
🧭 The preferred scenario is a nearby long-liquidation sweep at 63.1–63.3, where a substantial potential liquidation bar sits close to the reference price. However, dense short exposure at 64.2–65.8 also creates scope for two-way volatility.
🔻 Losing 63.1 without a reclaim would shift focus to long clusters at 62.1–62.5, followed by 61.0–61.8. A sweep of 63.1–63.3 followed by a quick reclaim of 63.5 would weaken bearish continuation.
🎯 Sustained trading below 61.0 would bring 59.4–60.0 into focus, particularly around 59.6. Bars across 60.2–60.8 are considerably smaller; sustained downside momentum through this stretch would matter for a deeper sweep.
⚖️ A break and hold above 63.8 would shift preference toward short sweeps at 64.2–65.8. Holding above 65.8 would bring major clusters near 66.6 and 67.8 into view, followed by 69.2–69.9. A rally into a major cluster followed by a drop below 63.8 would weaken this scenario.
#LiquidationMap
🧭 The preferred scenario is a nearby long-liquidation sweep at 63.1–63.3, where a substantial potential liquidation bar sits close to the reference price. However, dense short exposure at 64.2–65.8 also creates scope for two-way volatility.
🔻 Losing 63.1 without a reclaim would shift focus to long clusters at 62.1–62.5, followed by 61.0–61.8. A sweep of 63.1–63.3 followed by a quick reclaim of 63.5 would weaken bearish continuation.
🎯 Sustained trading below 61.0 would bring 59.4–60.0 into focus, particularly around 59.6. Bars across 60.2–60.8 are considerably smaller; sustained downside momentum through this stretch would matter for a deeper sweep.
⚖️ A break and hold above 63.8 would shift preference toward short sweeps at 64.2–65.8. Holding above 65.8 would bring major clusters near 66.6 and 67.8 into view, followed by 69.2–69.9. A rally into a major cluster followed by a drop below 63.8 would weaken this scenario.
#LiquidationMap