


Special report: After the sharp rebound, could the market fall even further?
It’s been a while since I last did a dedicated segment on U.S. stocks. Today, I’m taking an in-depth look at the U.S. stock market’s Christmas rally. After yesterday’s huge rebound, there’s just one question on everyone’s mind: Could the market still hit a lower low?
Let’s start with oil prices. Yesterday’s rebound was largely driven by oil breaking below its 200-day moving average. This was a clear signal, suggesting the end of an uptrend: within the price structure, the market had formed a higher low, but that level was ultimately broken by this decline. However, whether the breakdown will continue remains to be seen over the next two or three days. The market could still swing back and forth, so we shouldn’t declare a trend reversal based on a single day’s rebound.
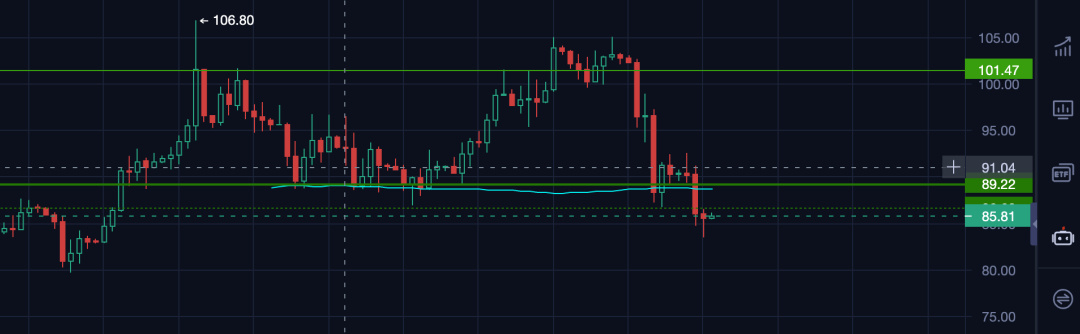
Oil and geopolitics: a peace deal would ease inflation and rate-hike pressure at the same time
On the news front, Iran made another overture yesterday, and Trump also made an unusually conciliatory comment. But note that the conditions for a peace deal are broadly consistent with the restrictions the Biden administration previously imposed on non-nuclear states. In other words, after going around in circles—losing the House and Senate, losing the midterm elections, and potentially facing a Democratic crackdown, impeachment, and more than 200 investigations, including allegations of improper stock gains involving the Trump family—we may end up right back where we started. Whether Trump is truly willing to accept that remains to be seen.
If oil prices keep falling, the knock-on effects are clear: we won’t need to worry so much about inflation or aggressive rate hikes, and the Fed may even have room to support the core driver of the U.S. economy right now—AI.
Wall Street’s “four things that won’t happen”: why each one proved wrong
Aside from prices, the market’s biggest concern about AI is the “four things that won’t happen” narrative that was popular on Wall Street this summer: the Fed won’t raise rates, the Democrats won’t sweep the elections, AI capital spending won’t be cut, and the economy won’t go into recession. Yet reality has proven each of these wrong. So even if prices rebound, these four fundamental factors have not fully changed.
Our view is that current prices, along with the lows set last Thursday and Friday, are most likely within a bottoming range. But when the market will return to a bull market and when risks will be fully eliminated remain unknown. That is why we don’t recommend going all in to buy the dip at once, and instead stick to dollar-cost averaging.
Nasdaq chart analysis: after a false breakdown, the target is 31,000
Next, let’s look purely at the Nasdaq’s price action to analyze what may happen next and how the Christmas rally could unfold.
In last Friday’s episode, after Thursday’s sharp sell-off, my view was “be greedy when others are fearful.” The price was at a level I had repeatedly highlighted: if the Nasdaq bull market continues, this is the ultimate downside target. Since the price had already fallen all the way to this level, we had ample reason to enter on the left side of the curve. That’s why last Friday I clearly recommended dollar-cost averaging into the Nasdaq in the VIP group—note that I meant buying QQQ, not the Nasdaq index itself.
For those who have already bought, I recommend taking profits gradually here, selling in stages while keeping some core holdings to wait for a second pullback. Why expect a second pullback? First, although this is a structural low, prices did not rebound quickly above it over the previous two days, raising concerns that it could break decisively. If the rebound fails to make a higher high, the market could develop a bearish structure. Fortunately, prices have now recovered above the level.
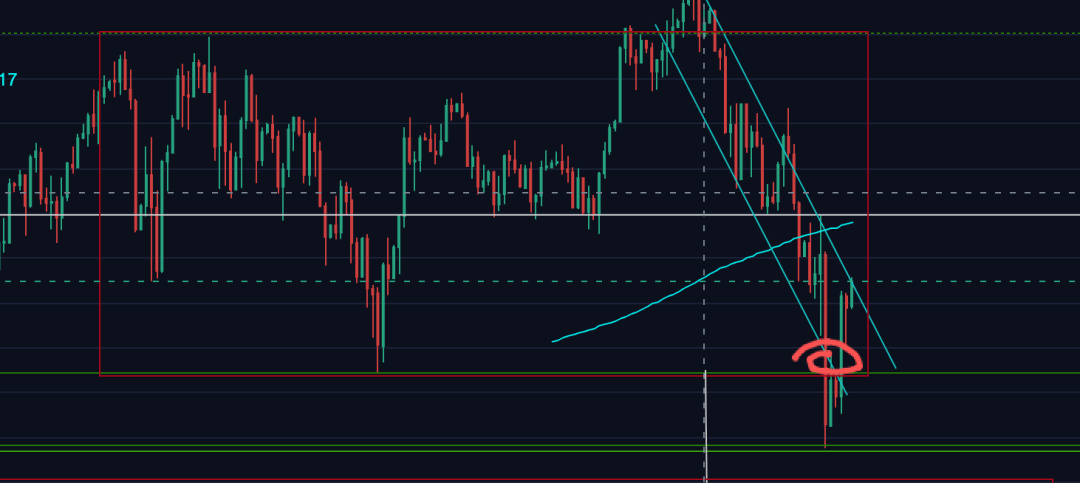
From a horizontal structure perspective, this can be viewed as a trading range. In early October, the price broke above the range and took liquidity above the equal highs. According to this structural logic, a retest of the structural low is a possible target. We now have equal lows here, and after one or two breaks below them to take liquidity, the market is currently showing signs of a false breakdown. Based on the range structure, there is ultimately a chance of returning to 31,000, or even to the previous high.
The 200-day moving average: the first rebound will likely meet resistance
The 200-day moving average is crucial to breaking the current structure and returning to a range-bound or rising market. There is strong resistance overhead, making it difficult to break through in one go. The opening price of the large bearish candle is also close to the 200-day moving average, so a large number of investors are likely trapped around that level. As a result, the first rebound to this area will probably meet resistance—and may not even reach it.
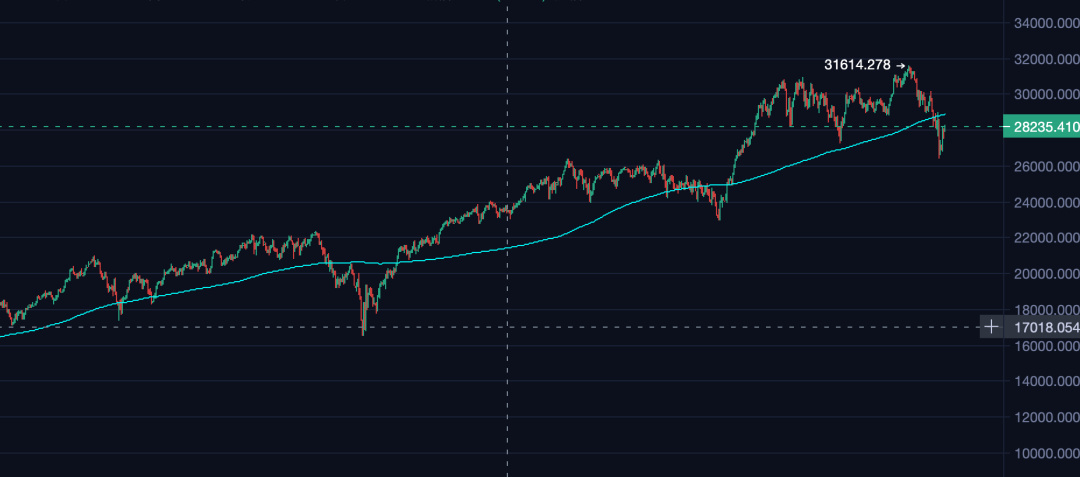
This is also the basis for my trading recommendation: if you bought at lower levels and have already made a sizable gain, consider taking partial profits while keeping some core holdings.
If we hide the other technical indicators and look only at the 200-day moving average, we can see that several historical sell-offs have broken below it: the 2021–2022 rate-cutting cycle, disruptions from Trump’s policies, the U.S.-Iran conflict earlier this year, and the current episode. There were also several brief dips below it, including when Powell signaled more aggressive rate hikes and when Japan raised rates. After Japan raised rates, the carry trade—borrowing cheap yen to invest in U.S. stocks—plunged rapidly, but the price recovered after printing a long lower wick.
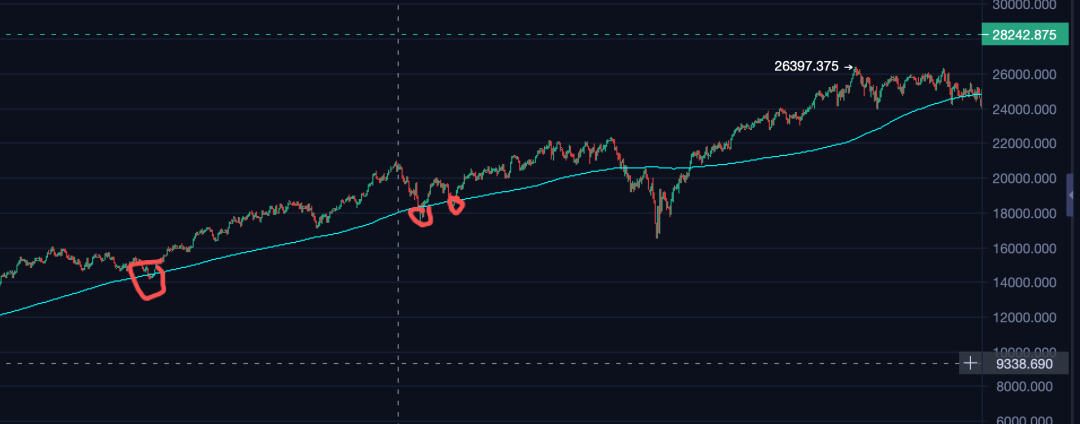
Historical pattern: after breaking below the moving average, the market usually makes a lower low
Looking at these decisive breaks, we can identify a pattern: after the initial drop, the price retests the 200-day moving average but fails to break above it, then falls again to make a lower low. It retests once more and still fails, forming the ultimate low; a third attempt also fails. Only when the structure changes and the price makes a higher high, then breaks above and retests the 200-day moving average, does a long bull market begin.
The same thing happened in early 2025: trade war news triggered a rapid break below the moving average. The first attempt to reclaim it failed, followed by a much deeper lower low. The market only began its next bull run after recovering above and retesting the 200-day moving average. The sell-off during the U.S.-Iran war was the fastest rebound after a decisive break below the moving average. The pattern was also a bearish candle, a rebound, a lower low, consolidation, reclaiming the level, and a successful retest before the bull market began.
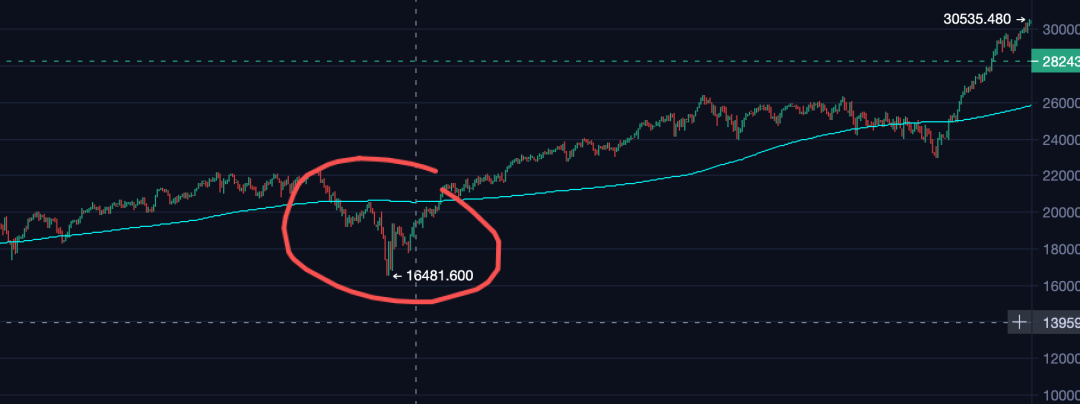
This supports our first conclusion: the current decline is clearly not a simple dip below the moving average followed by a quick recovery; it is following a structure similar to historical examples. Technically, the price has been decisively below the moving average for several days. Fundamentally, this is not a case of a single negative catalyst being quickly priced in, followed by the market stabilizing above the 200-day moving average and rebounding. The Fed still cannot confirm whether the upcoming CPI reading will show that inflation is truly under control. The Democrats have already swept the elections and are beginning to investigate Trump, Musk, and Jensen Huang, who is closely linked to AI. Rumors of Huang’s affair had been around for some time—many people in Taiwan knew about it in June—and its reemergence now looks more like part of a targeted investigation.
AI’s two key risks: obstacles to capital spending and extreme concentration
More importantly, there are two other factors. First, confidence that AI capital spending will not be cut is starting to falter. Even if the relevant Democratic legislation may not ultimately pass, it is already creating a real obstacle. Second, Bank of America’s chief strategist, Michael Hartnett, pointed out that the top 10 AI giants account for a record 41% of stock-picking exposure, matching the concentration of tech stocks during the 2000 dot-com bubble. This kind of historical extreme means that a correction is genuinely needed—and it is unlikely to be shallow.
The deeper issue is that expectations for AI capital spending keep growing, the cash shortfall is widening, and the Fed still cannot begin cutting rates. So although this market is close to a bottom, this is not a simple correction, and it will not be wrapped up with a quick V-shaped reversal.
Will history repeat itself? Both similar scenarios point to choppy trading and new lows
In the most recent comparable cases, a bearish candle is followed by a rebound. Once the rebound loses momentum and approaches the 200-day moving average and the opening price of the large bearish candle, the market falls again and makes a lower low. If we combine the entire candlestick sequence into one large bearish candle, then after a sluggish weekend, Monday could still open with a large bullish candle. But it would take some time to regain the 200-day moving average—in other words, it will take at least another week or so to emerge from the gloom.
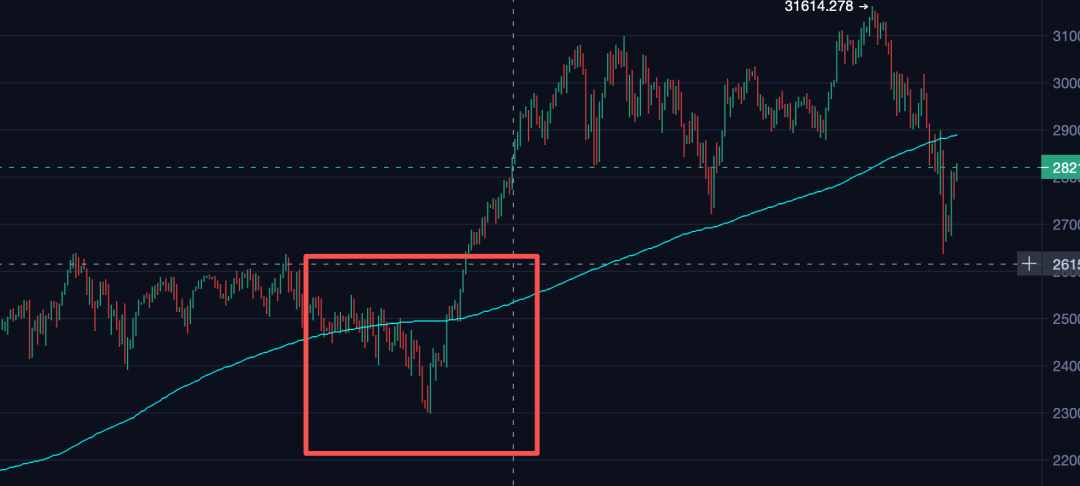
Another historical parallel shows the same pattern: after falling below the 200-day moving average and printing a large bearish candle, the price rallied toward the moving average, met resistance, then fell again and made a lower low. The difference is that the earlier period was a purely aggressive rate-hiking cycle, whereas the current cycle is relatively mild and could reverse at any time—especially if the conflict in Iran is resolved. The correction is unlikely to last as long or go as deep as it did last time. But the shared lesson remains: as long as the price is below the 200-day moving average and has not quickly reclaimed it, the possibility of making further lows remains.
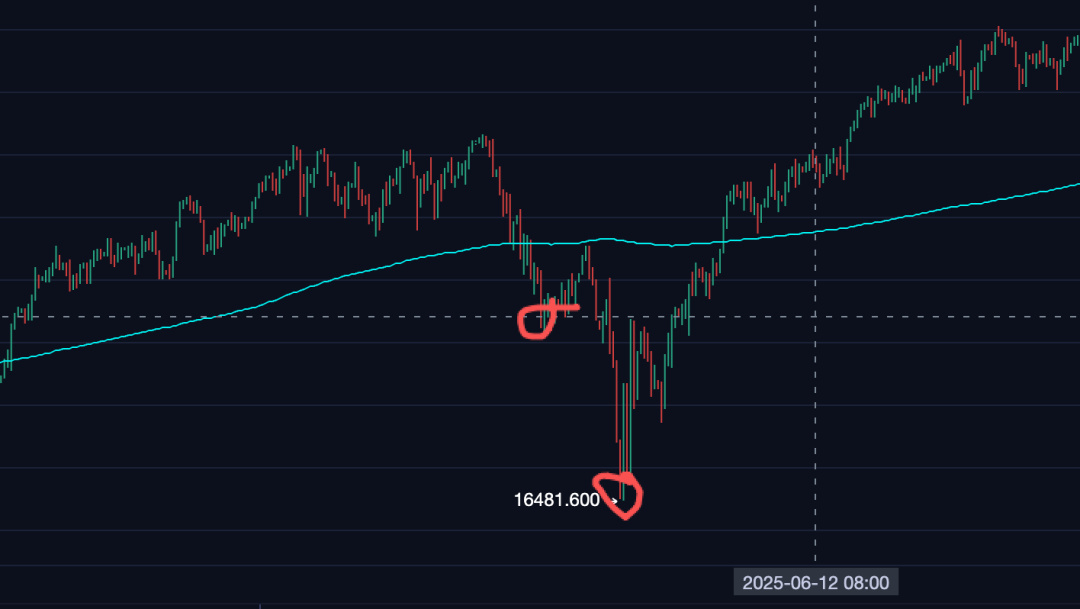
A strict rule for trading: dollar-cost average within a range—don’t go all in, don’t stay entirely in cash, and don’t chase a frenzy
So we should be prepared for the possibility of even lower lows. In terms of trading, I recommend dollar-cost averaging within a range here rather than trying to pick the bottom with a single purchase. But hearing that there may be lower lows ahead is no reason to sell all your holdings at once, either.
A key prerequisite to avoiding irrational decisions is to always have some exposure: otherwise, if prices keep surging, you may not be able to resist chasing the rally and adding to your position. Such high-priced entries often involve a large position, and if you get caught at the top and prices fall again, the consequences can be dire. Remember these two rules: never go all in, and never be completely out of the market. This rule is highly effective in a volatile market.
A review of the Christmas rally: only one of five historical periods followed a similar pattern, with a decline of nearly 10%
Looking back at the five Christmas rallies from 2021 to 2025, only one resembled the current situation of the Nasdaq falling below its 200-day moving average. From November 10 through year-end, the market saw a decline of nearly 10%. The other periods all took place while the 200-day moving average was rising.
Excluding the two periods in 2023 and 2024, which did not follow a similar pattern: in those years, AI stocks performed well, earnings kept surprising to the upside, models evolved rapidly, and the 200-day moving average showed no sign of topping out. The market continued to rise despite year-end position adjustments and withdrawals by hedge funds and active funds. Of the other two periods, one was a topping phase ahead of a rate-hiking cycle and was basically range-bound, with almost no gains; the other had not fully bottomed out and was later shown to possibly have formed a double bottom, and it also made almost no gains. So even if the market follows the paths of 2021 or 2025, and even if fundamentals are more optimistic than they are now, the result may still be a rebound followed by choppy trading, with little overall gain.
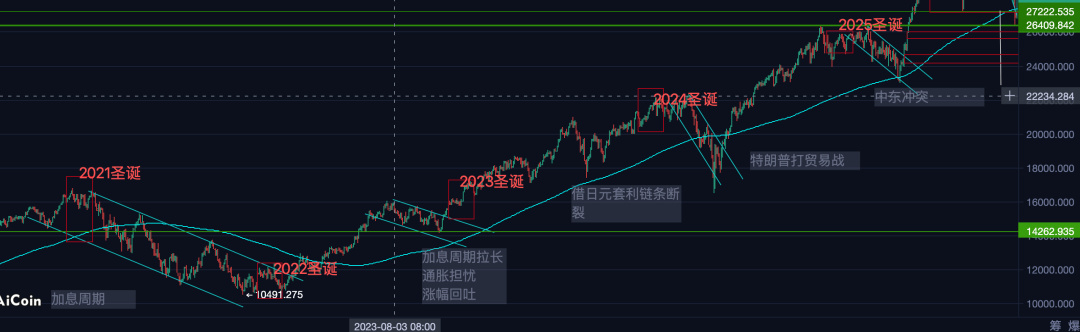
Returning to the present, we are still below the 200-day moving average. Fundamentals have not fully reversed, and risks remain substantial, so we cannot expect an immediate return above the moving average and the start of a bull market. Even after such a steep decline, the market needs a period of consolidation, and a new low cannot be ruled out.
Two possible market scenarios: a false breakdown followed by consolidation, or an ultimate low near 23,000
I’m not predicting a black swan event; I’m simply outlining two possible scenarios based on the price action.
First scenario: liquidity has already reached this area, making this a healthy reset for AI, U.S. stocks, and the Nasdaq. The price will not decisively break below the structural low. Instead, it will test the low several times and consolidate, occasionally breaking below it in a panic before recovering. Institutions and market makers will take advantage of unsettled conditions to shake out bulls and ease the crowded positioning in the bull market. In this scenario, this is confirmed as a false breakdown, and the market will most likely consolidate, rebound toward the 200-day moving average and meet resistance, then retest the bottom.
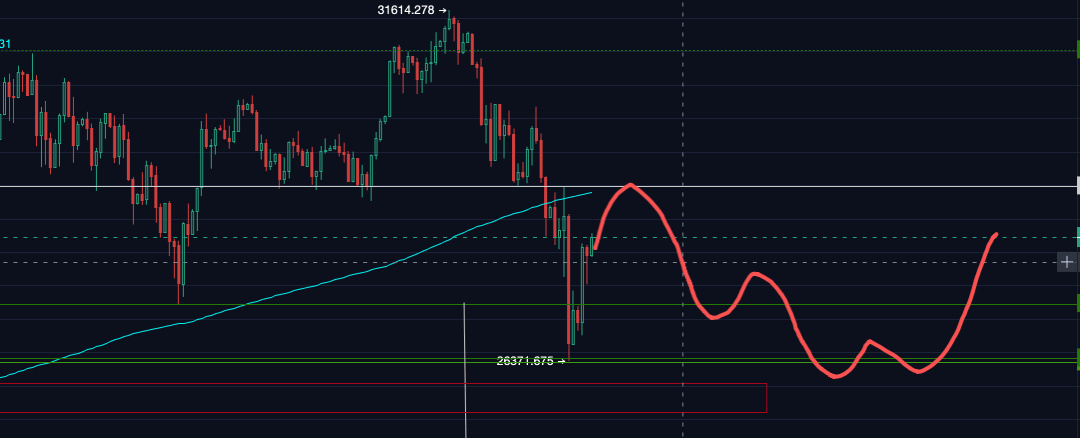
Second scenario: there are lower lows ahead, and the current support-turned-resistance level is not the final low. Now that the structural low has been broken, we can no longer view this as a sequence of higher lows and higher highs. Zooming out, the structural low is further to the left on the chart. This is essentially an M-shaped top, with the structural low marking the neckline. Projecting the pattern’s height downward puts the target near the structural low on the left. If even more frightening news emerges, that area could be the ultimate level—the absolute floor.
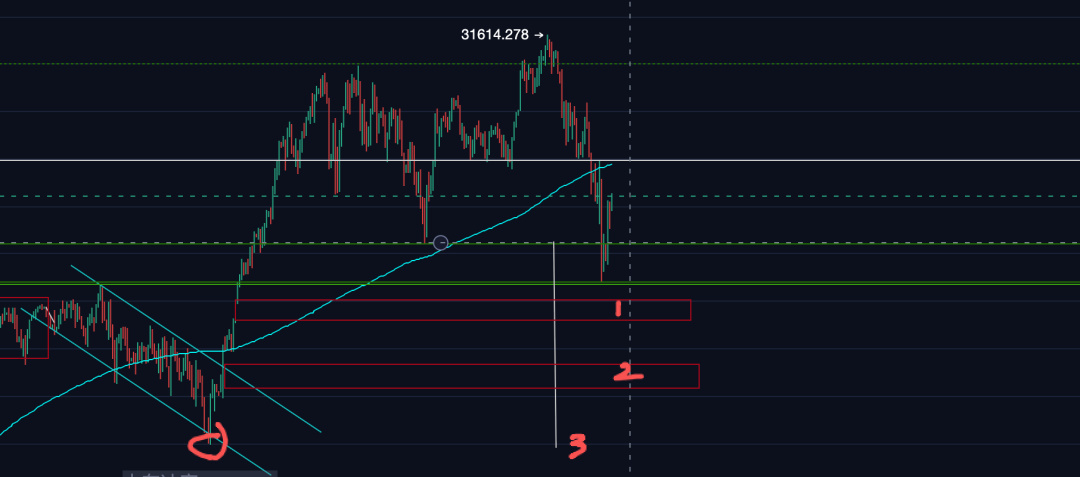
Will the market fall below 23,000? I believe the probability is no more than 10%. Looking back over the past six years, there has not been a single decisive break below a structural low. But there is a possibility of moving in that direction and reaching the liquidity below the rapid rally. The two FVG gaps below are relatively suitable levels: if the market falls to a gap and rebounds, I’ll increase my position for buying the dip; in the current range, I’ll stick to dollar-cost averaging.
Why I believe the long bull market isn’t over: personal scandals don’t change a company’s value, and capital always finds an outlet
As of now, I still don’t believe the Nasdaq’s two-decade bull market is over.
The market is concerned about Jensen Huang’s alleged affair because if his image as a leading spokesperson for AI collapses, it could become a serious problem. But history offers some perspective: Jeff Bezos’s affair became public in 2019, yet Amazon’s market capitalization has since grown by about $2 trillion. Elon Musk has also faced controversy over his personal relationships, and he is still one of the world’s richest people. Putting personal matters aside, this will not fundamentally affect Nvidia’s long-term prospects. Nvidia in the $160–$180 range is an excellent area for dollar-cost averaging. If the issue were to escalate into a spy case or a national security matter, of course the impact would be enormous. But I don’t believe that will happen: the Democrats would not undermine their own country’s leading companies and industries in the name of national security.
There’s no need to be pessimistic about the pause in approvals for AI infrastructure hubs, either. Large companies are not necessarily limited to building infrastructure on Nasdaq or in the United States; they can easily shift to Southeast Asia or South America. They could even, as Elon Musk has suggested, use Starship to deploy AI computing power in space. He recently said that if Starship’s orbital launch cost falls to $100 per kilogram, it could be cheaper than building computing centers on the ground, especially with solar power in space—and electricity is one of the major constraints on AI computing growth today. This is a long-term goal, but it illustrates a simple principle: capital will always find an outlet for the problems we worry about today.
The real long-term concern: no infrastructure boom escapes the laws of bubbles
The real concern is the limits of infrastructure spending. When it reaches an extreme, every infrastructure boom in history—railways, electricity, the internet—has struggled to avoid a full-blown bubble in the end. So even if the Nasdaq recaptures the 200-day moving average, approaches its previous high, or even makes a new one, we don’t know how long the rally can last.
But before a crisis arrives, shares this cheap are very close to the bottom, even if they are not at the absolute low. The plan from here is to stay cautious while remaining optimistic.
Conclusion
In last Friday’s program, after the sharp sell-off, we clearly took the contrarian view that “be greedy when others are fearful” and alerted our VIP community to start dollar-cost averaging into QQQ right away. We also shared our profit-taking strategy for the rebound and how to manage core holdings in the group. The public community also gets advance notice of key market levels. No hype, no calls to buy or sell—we simply explain the market structure and how to respond.

If you’d like to keep up with the U.S. stock market’s Christmas rally, key Nasdaq levels, and dollar-cost-averaging strategies, please like and follow this account. I’ll share more about U.S. stocks in future posts.