
We’re continuing our daily market monitoring! The QI (BENQI) trading pair in the “Monitoring” category is showing upward momentum from recent lows, gaining +23.71% over the day and trading at 0,002030 USDT (locally on the chart — 0,002031).
Key indicators and the technical picture from the chart:
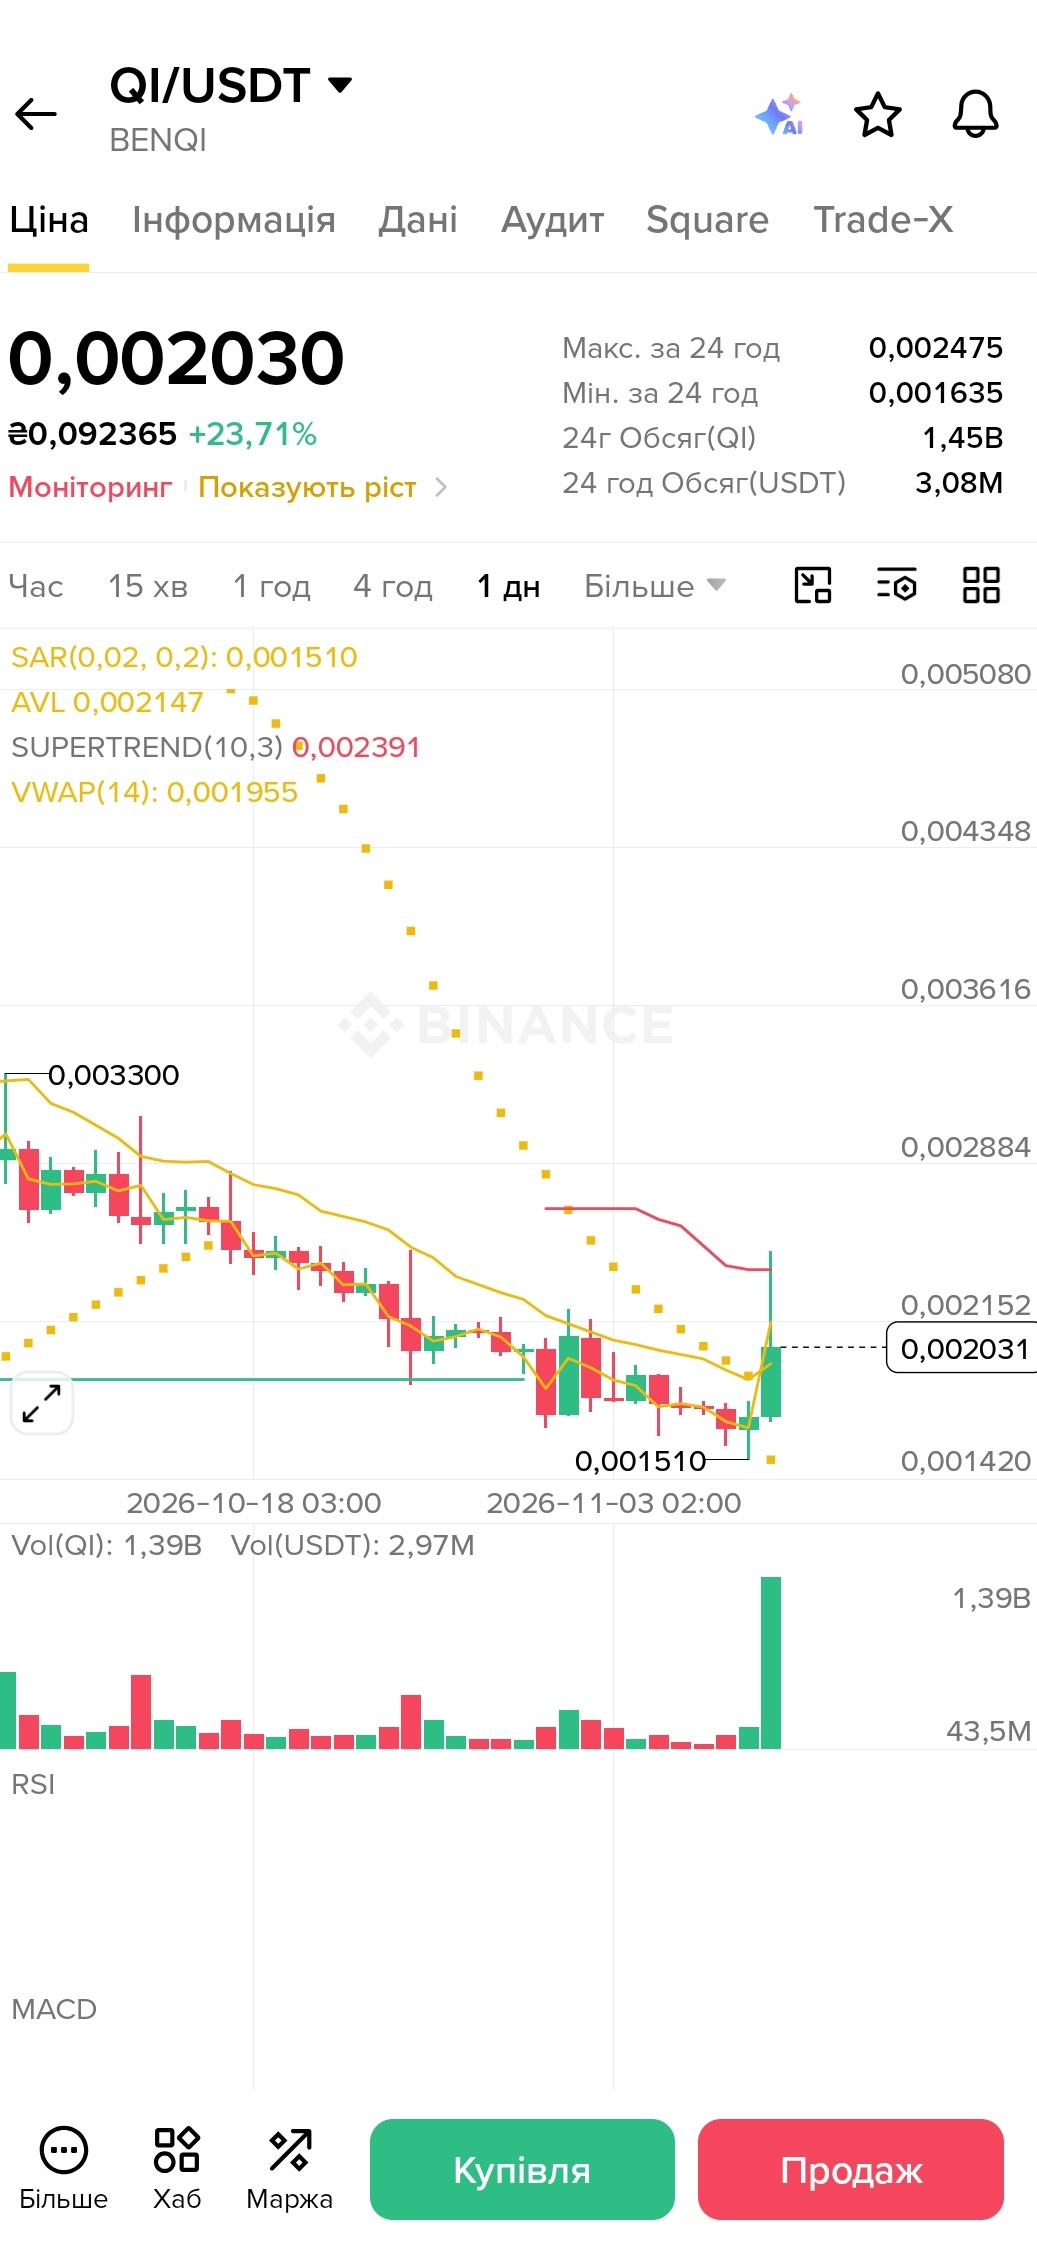
After a prolonged decline and the formation of a local bottom at 0,001510 USDT, the asset formed a reversal impulse, printing a powerful green candle and testing the 24-hour high of 0,002475 USDT (with a 24-hour low of 0,001635 USDT). The price is now consolidating in the upper zone after the daily surge.
Daily trading turnover is 3.08 million USDT (with a volume of 1.45 billion QI), confirming an influx of liquidity. The Vol(QI) trading volume of the current surge has reached an impressive 1.39B.
The Parabolic SAR indicator is at 0.001510 USDT, remaining below the price. The VWAP (14) indicator runs through 0.001955 USDT, while the AVL average price is at 0.002147 USDT, acting as the nearest dynamic resistance zone. Meanwhile, the Supertrend (10,3) line is higher, at 0.002391 USDT.
⚠️ A reminder that assets tagged “Monitoring” are prone to increased volatility. Don't give in to emotions (FOMO)—be sure to set stop-losses and strictly manage your risk!
💬 What do you think of BENQI's recovery? Can the asset hold above the AVL level of $0.0021 and continue rising, or are you expecting a pullback to VWAP? Share your thoughts in the comments, and have a profitable day, everyone! 👇
#BinanceSquare #QI #Benqi #monitoring #cryptotrading #TechnicalAnalysis #Altcoins