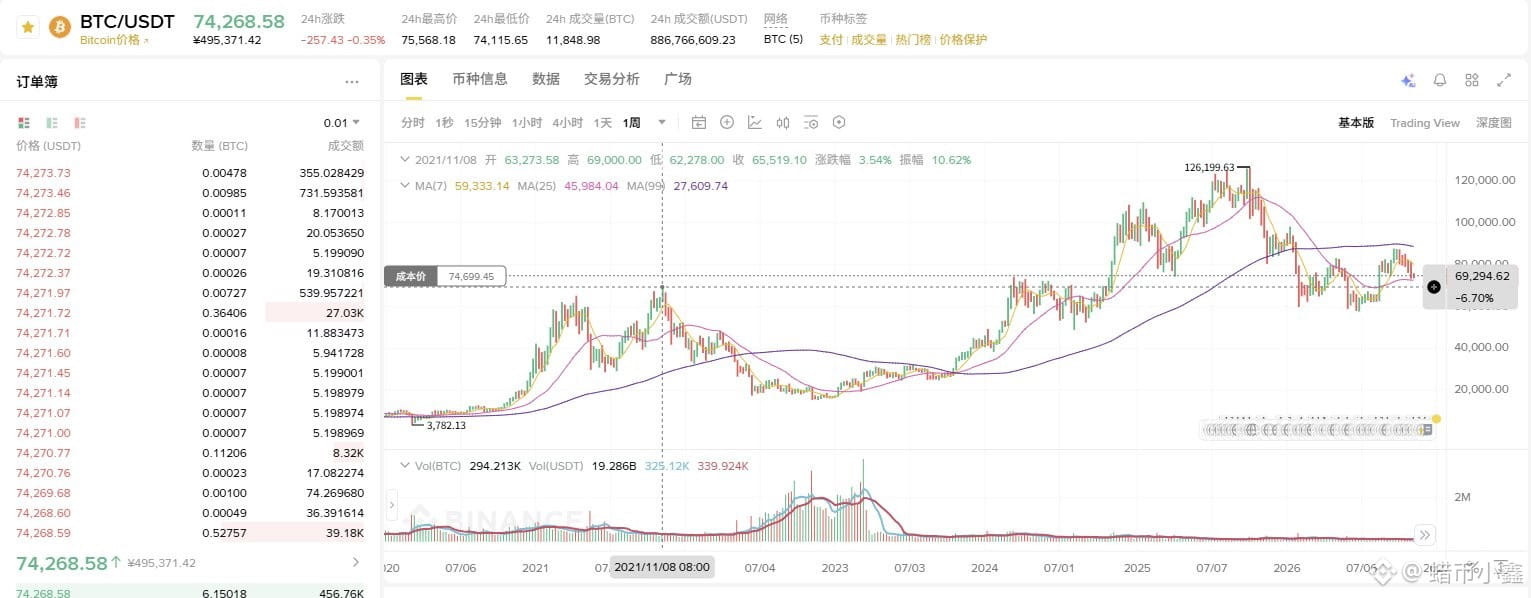

On this day 5 years ago, November 10, 2021, BTC surged to $69,000—the peak of the previous bull market.
On this day 5 years later, BTC is hovering around $75,000.
After holding for 5 years, a gain of less than 10%—that may be how a lot of people are really feeling today.
😅
Looking at the past few weeks:
📉 BTC has closed 5 consecutive weekly candles in the red, falling from $86,500 all the way to $74,800—a drop of 13.5%.
📉 Spot ETFs saw net outflows of about $1.28 billion last week, while BlackRock’s IBIT recorded outflows for 7 consecutive trading days.
📉 Mining company MARA sold 13,597 BTC over 6 weeks, raising $1.1 billion, and said it plans to keep selling.
📈 Meanwhile, Strategy is still buying, with its holdings now exceeding 850,000 BTC.
The most painful part: U.S. stocks surged last night, with the Philadelphia Semiconductor Index up nearly 7%, but BTC barely moved. Crypto didn’t follow at all. The Fear & Greed Index has also stayed around 30.
Tonight at 9:30 p.m. Beijing time, the U.S. will release October CPI data. The market expects a 0.3% month-over-month increase, and a 0.2% increase in core CPI.
If the data comes in hot, expectations of a December rate hike will keep rising; if it comes in cool, we could see a relief rally. But unless ETF inflows return, the rally’s staying power remains questionable.
The key short-term level to watch is $73,000. If it holds, BTC could continue to grind along; if it breaks, watch out for a test of $70,000. #BTC走势分析 #CPI前瞻,12月利率走向迎关键考验
On this day 5 years later, BTC is hovering around $75,000.
After holding for 5 years, a gain of less than 10%—that may be how a lot of people are really feeling today.
😅
Looking at the past few weeks:
📉 BTC has closed 5 consecutive weekly candles in the red, falling from $86,500 all the way to $74,800—a drop of 13.5%.
📉 Spot ETFs saw net outflows of about $1.28 billion last week, while BlackRock’s IBIT recorded outflows for 7 consecutive trading days.
📉 Mining company MARA sold 13,597 BTC over 6 weeks, raising $1.1 billion, and said it plans to keep selling.
📈 Meanwhile, Strategy is still buying, with its holdings now exceeding 850,000 BTC.
The most painful part: U.S. stocks surged last night, with the Philadelphia Semiconductor Index up nearly 7%, but BTC barely moved. Crypto didn’t follow at all. The Fear & Greed Index has also stayed around 30.
Tonight at 9:30 p.m. Beijing time, the U.S. will release October CPI data. The market expects a 0.3% month-over-month increase, and a 0.2% increase in core CPI.
If the data comes in hot, expectations of a December rate hike will keep rising; if it comes in cool, we could see a relief rally. But unless ETF inflows return, the rally’s staying power remains questionable.
The key short-term level to watch is $73,000. If it holds, BTC could continue to grind along; if it breaks, watch out for a test of $70,000. #BTC走势分析 #CPI前瞻,12月利率走向迎关键考验