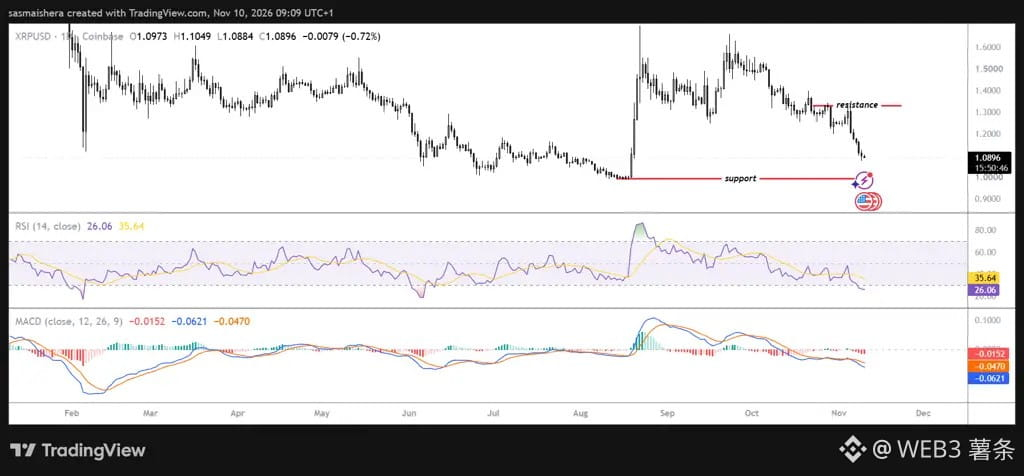
XRP is currently trading at around $1.097. Overall, its trend remains weak, with the price continuing to trade below the 50-day moving average ($1.294), 100-day moving average ($1.303), and 200-day moving average ($1.365). This indicates substantial selling pressure and several layers of resistance overhead, making a short-term rebound difficult.
As for technical indicators, the daily RSI is around 26, already in oversold territory. This suggests that recent losses have been steep and that a short-term rebound may be possible. However, the MACD remains in negative territory, indicating that bears (sellers) are still in control.
Here are several key levels to watch:
Key support: $1. This is an important psychological threshold; a decisive break below it could trigger further declines.
First resistance: $1.16. The short-term outlook may improve only if XRP moves back above this level.
Major resistance: $1.30–$1.303, corresponding to the 50-day and 100-day moving averages. A breakout may be difficult.
Next target: $1.365, corresponding to the 200-day moving average.
If buying pressure strengthens significantly and XRP successfully breaks through these resistance levels, it could go on to test $1.54 or even $1.90.
As for technical indicators, the daily RSI is around 26, already in oversold territory. This suggests that recent losses have been steep and that a short-term rebound may be possible. However, the MACD remains in negative territory, indicating that bears (sellers) are still in control.
Here are several key levels to watch:
Key support: $1. This is an important psychological threshold; a decisive break below it could trigger further declines.
First resistance: $1.16. The short-term outlook may improve only if XRP moves back above this level.
Major resistance: $1.30–$1.303, corresponding to the 50-day and 100-day moving averages. A breakout may be difficult.
Next target: $1.365, corresponding to the 200-day moving average.
If buying pressure strengthens significantly and XRP successfully breaks through these resistance levels, it could go on to test $1.54 or even $1.90.