
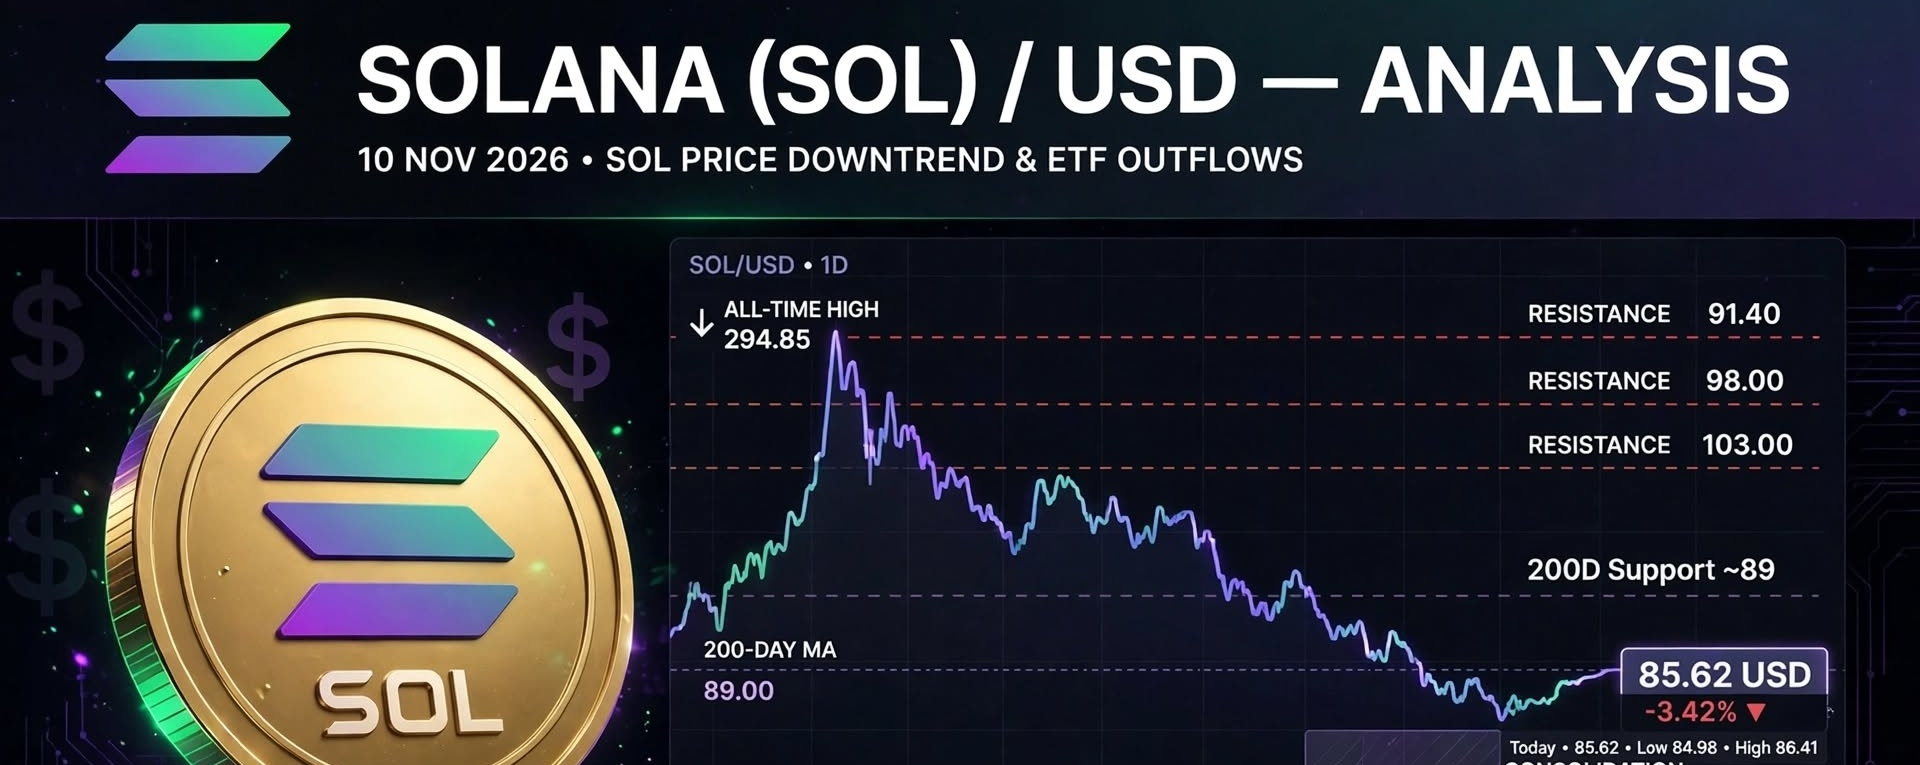

$SOL / USD - Complete Analysis - 10 Nov 2026

1. Live Price Snapshot
Current Price: ∼$85.70 - $86.60
24h Change: -1.3% to -3.1% depending on exchange
24h Range: $85.14 - $88.07
24h Volume: ∼$2.26B
| Metric | Value |
| --- | --- |
| Market Cap | ~$50.5B - $51.2B |
| Circulating Supply | ∼591.09M SOL |
| Total Supply | ∼637.25M SOL |
| All-Time High | $294.85 |
| Distance from ATH | -71% |
| YTD Return | -31.73% |
| 1-Year Return | -48.22% |
| 5-Session Return | -9.38% |
195d29ed
Verdict on trend: $SOL is in a clear medium-term downtrend in 2026, after a -19% drop in October alone. It has lost its post-election rally and is now testing long-term support.
2. Technical Analysis
$SOL is trading below all short and medium-term moving averages, but still hovering around its 200-day average - which is the battleground right now.
Key Levels:
| Type | Level | Why it matters |
| --- | --- | --- |
| Immediate Support | $85.33 | Nearest support today |
| Strong Support | $83.98 - $85.00 | Breakdown zone, next stop if $85 fails |
| Critical Support | $80.00 | Major psychological level, Investtech support 3d7d |
| 200-Day SMA | $88.93 - $89.04 | SOL sits just above it, bulls defending it |
| Immediate Resistance | $87.74 | First resistance today |
| Key Resistance | $91.40 | 0.618 Fibonacci retracement from $70.51 low to $125.19 high - must reclaim |
| Major Resistance | $95.00 - $97.00 | Cluster: $95, $97.76, $98.04 (200-day EMA) |
| Trend Reversal | $98.04 - $103.12 | 200-day EMA, 20-day EMA ($100.09), 50-day EMA ($103.12) |
| Bull Confirmation | $103+ daily close | Required to confirm broader reversal |
a8fa40becfcd6b34
Indicators:
RSI (14-day): ∼32.4 - Just above oversolgly negative 40be
MA Structure: Below MA-20 and MA-50, above MA-200 = short-term bearish, long-term support still holding
Ichimoku Kijun: $89e resistance 76c2
Bollinger: Lower band at $91.39 was previous support, now broken
3. Fundamentals & News - What's Driving It
A) ETF Flows - The Biggest Headwind
US spot Solana ETFs posted a record $71.47M weekly outflow in the week ended Oct 30, the largest since launch. Flows then froze - **zero net flows for 4 straight 8M on Nov 5. bfc2
Total AUM: $1.33B vs $1.467B invested
Bitwise's BSOL led withdrawals with $45.82M, still holds $1.12B cumulative inflows
Funds launched Oct 28, 2025, took in ∼$1.59B in first year, while price fell ∼38% in same window
B) Upcoming Catalysts - November
Nov 15 Deadline - VanEck JitoSOL ETF: SEC must approve or reject by Nov 15, 2026. First US fund holding a liquid staking token, not SOL directly. JitoSOL yieldork average. 67cf
Nov 19 - Fidelity Spot SOL ETF Launch: Reported launch date, could bring fresh institutional demand.
Grayscale GSOL: Converted to staking ETF on Nov 7, holds 1,452,623 SOL as of Nov 6.
Bitwise BSOL: Holds 10,149,221 SOL, ∼96% staked at 5.80% net reward rate.
C) Network Strength
Solana remains the fastest major L1 for DeFi, memecoins, and payments, and staking ETFs are unique - SOL ETFs were the first crypto ETFs to pay yield from the start. That structural advantage hasn't changed, even if price has.
4. Three Scenarios for November 2026
1. Bearish - Breakdown (30% probability)
Close below $85, then $80 breaks. Target: $70 - $75
Trigger: ETF outflows resume, BTC falls, SEC rejects JitoSOL.
2. Base Case - Consolidation (50% probability)
Range $85 - $104. SOL chops between $85 support and $98-$103 resistance, absorbing selling.
Trigger: ETF flows stabilize, Fidelity launch offsets outflows.
3. Bullish - Reversal (20% probability)
Daily close above $98.04 (200-day EMA), then $103. Target: $110 - $120
Trigger: JitoSOL approval + Fidelity inflows + BTC recovery.
5. Price Predictions - Analyst Consensus
| Source | 2026 End | 2027 End |
| --- | --- | --- |
| Standard Chartered | $250 (cut from $310) | $400 |
| Model Consensus | $71 - $95 base, $86 - $122 range | $86 - $144, base $115.45 |
| Cautious Models | $74 - $95 | $79 - $180 |
| Bullish Models | Up to $350 | Up to $600 |
c62f6f4ba06f
Long-term, Standard Chartered still projects $700 by 2028, $1,200 by 2029, $2,000 by 2030 - but those require a full crypto bull market return.
6. What Should You Watch?
This Week:
Hold above $85? If yes, bounce to $91.40 is likely.
Lose $85 on daily close? Next is $80.
Nov 15 SEC decision - biggest near-term catalyst.
ETF daily flows - need to turn positive again.
Risk Note: This is not financial advice. SOL is down 48% in 1 year and is in oversold territory, which often produces sharp bounces, but also means trend is still down until $98 is reclaimed. Don't catch a falling knife with leverage.
Want me to do:
A short-term trading plan for SOL with entry, stop-loss, and targets in USD?
A DCA / long-term accumulation plan?
Comparison SOL vs ETH vs BTC right now?
#solana #SOLUSDT #solanAnalysis #TrendingPredictions #viralpost