


Bitcoin briefly fell below $74,000, hitting its lowest level since August
The cryptocurrency market was hit by another bout of severe volatility. Bitcoin ($BTC) briefly fell below $74,000 yesterday (11/9), reaching a low of around $73,708—its lowest level since August this year. As prices plunged rapidly, a large number of leveraged long positions were forcibly liquidated. More than $1 billion worth of positions were liquidated across the cryptocurrency market within 24 hours.
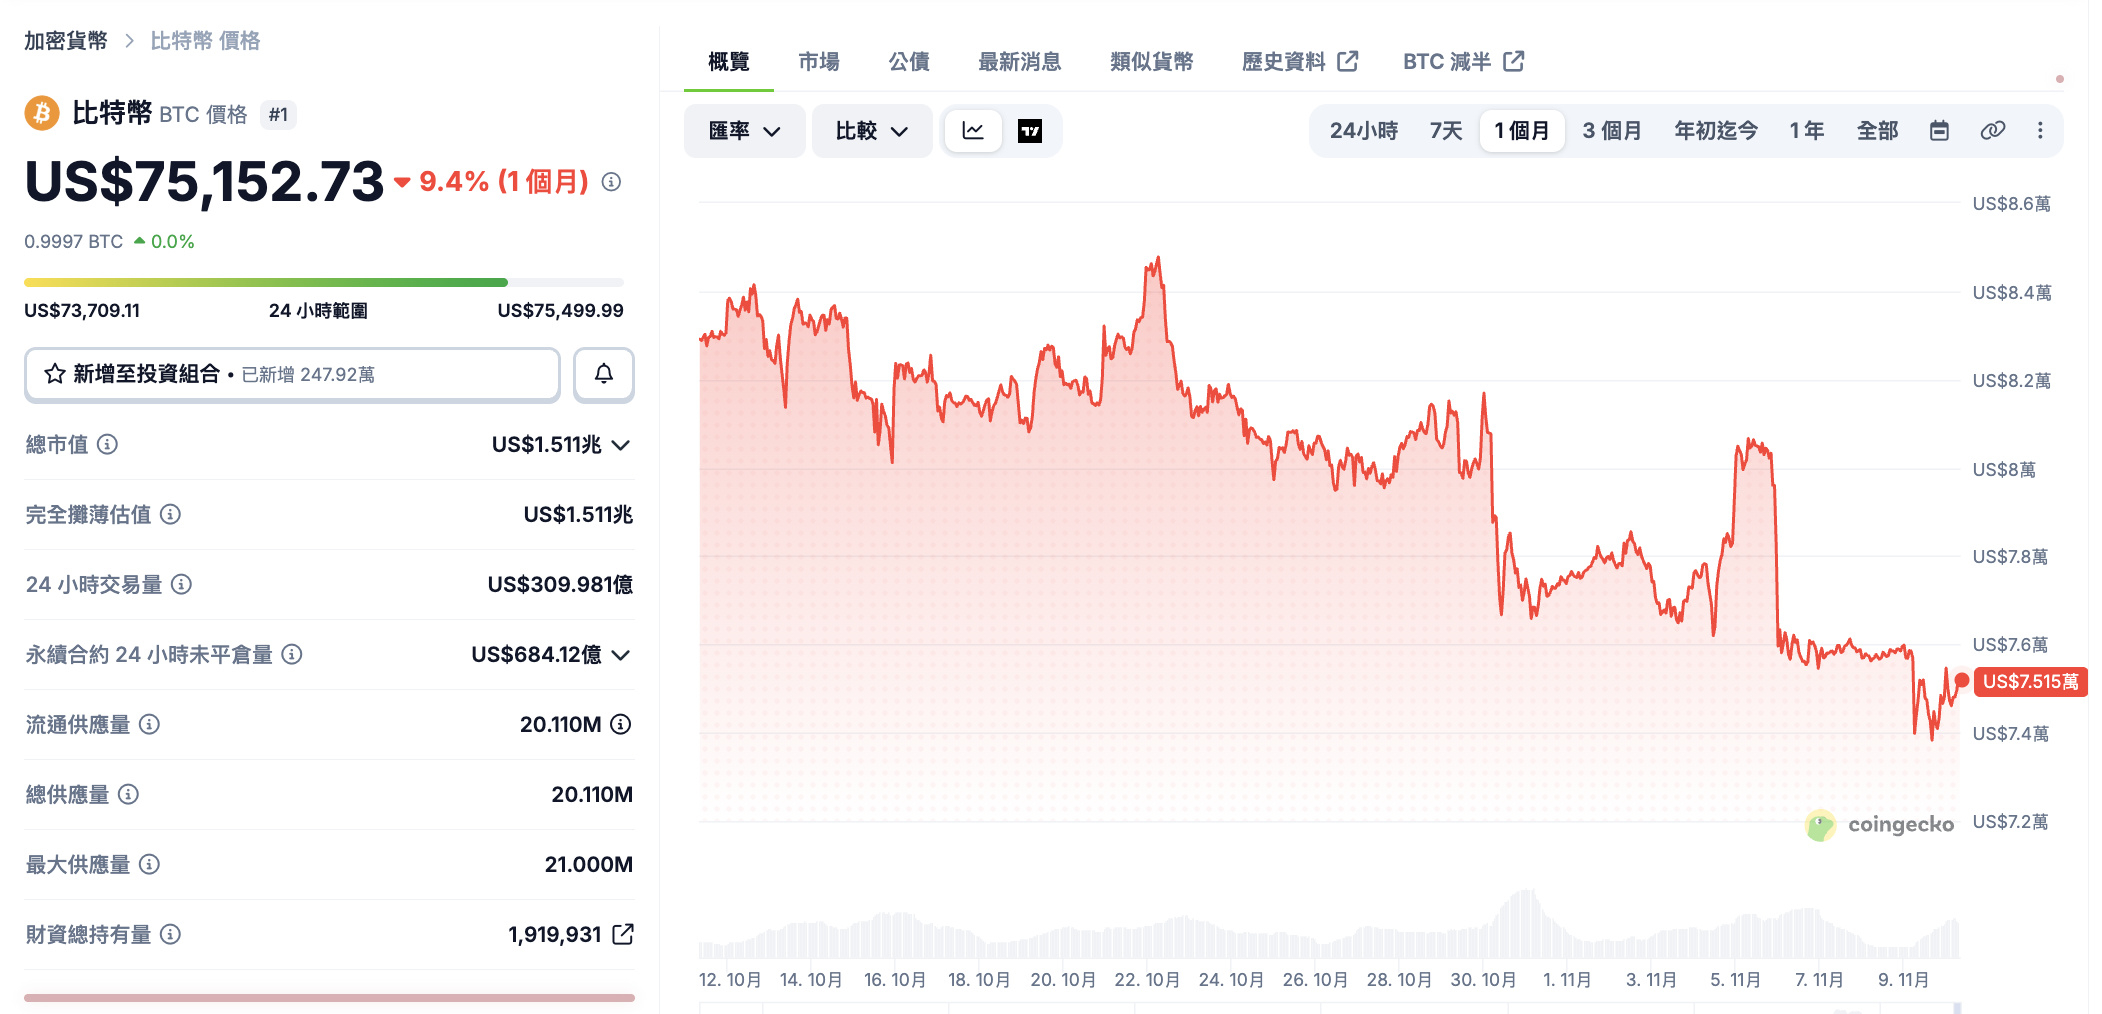 Source: CoinGecko Bitcoin ($BTC) briefly fell below $74,000 yesterday (11/9), hitting a low of around $73,708
According to reports by (BeInCrypto) and (The Block), Bitcoin continued to face selling pressure over the weekend. Its brief rebound above $76,000 quickly faded, while Ethereum ($ETH) also briefly fell to around $2,100, signaling that market risk appetite remains weak.
However, the market has seen a partial rebound this morning. According to CoinGecko data, as of publication, Bitcoin had recovered to around $75,160, up 1.7% over the past 24 hours but still down 9.4% over the past month. Ether was trading at around $2,131.
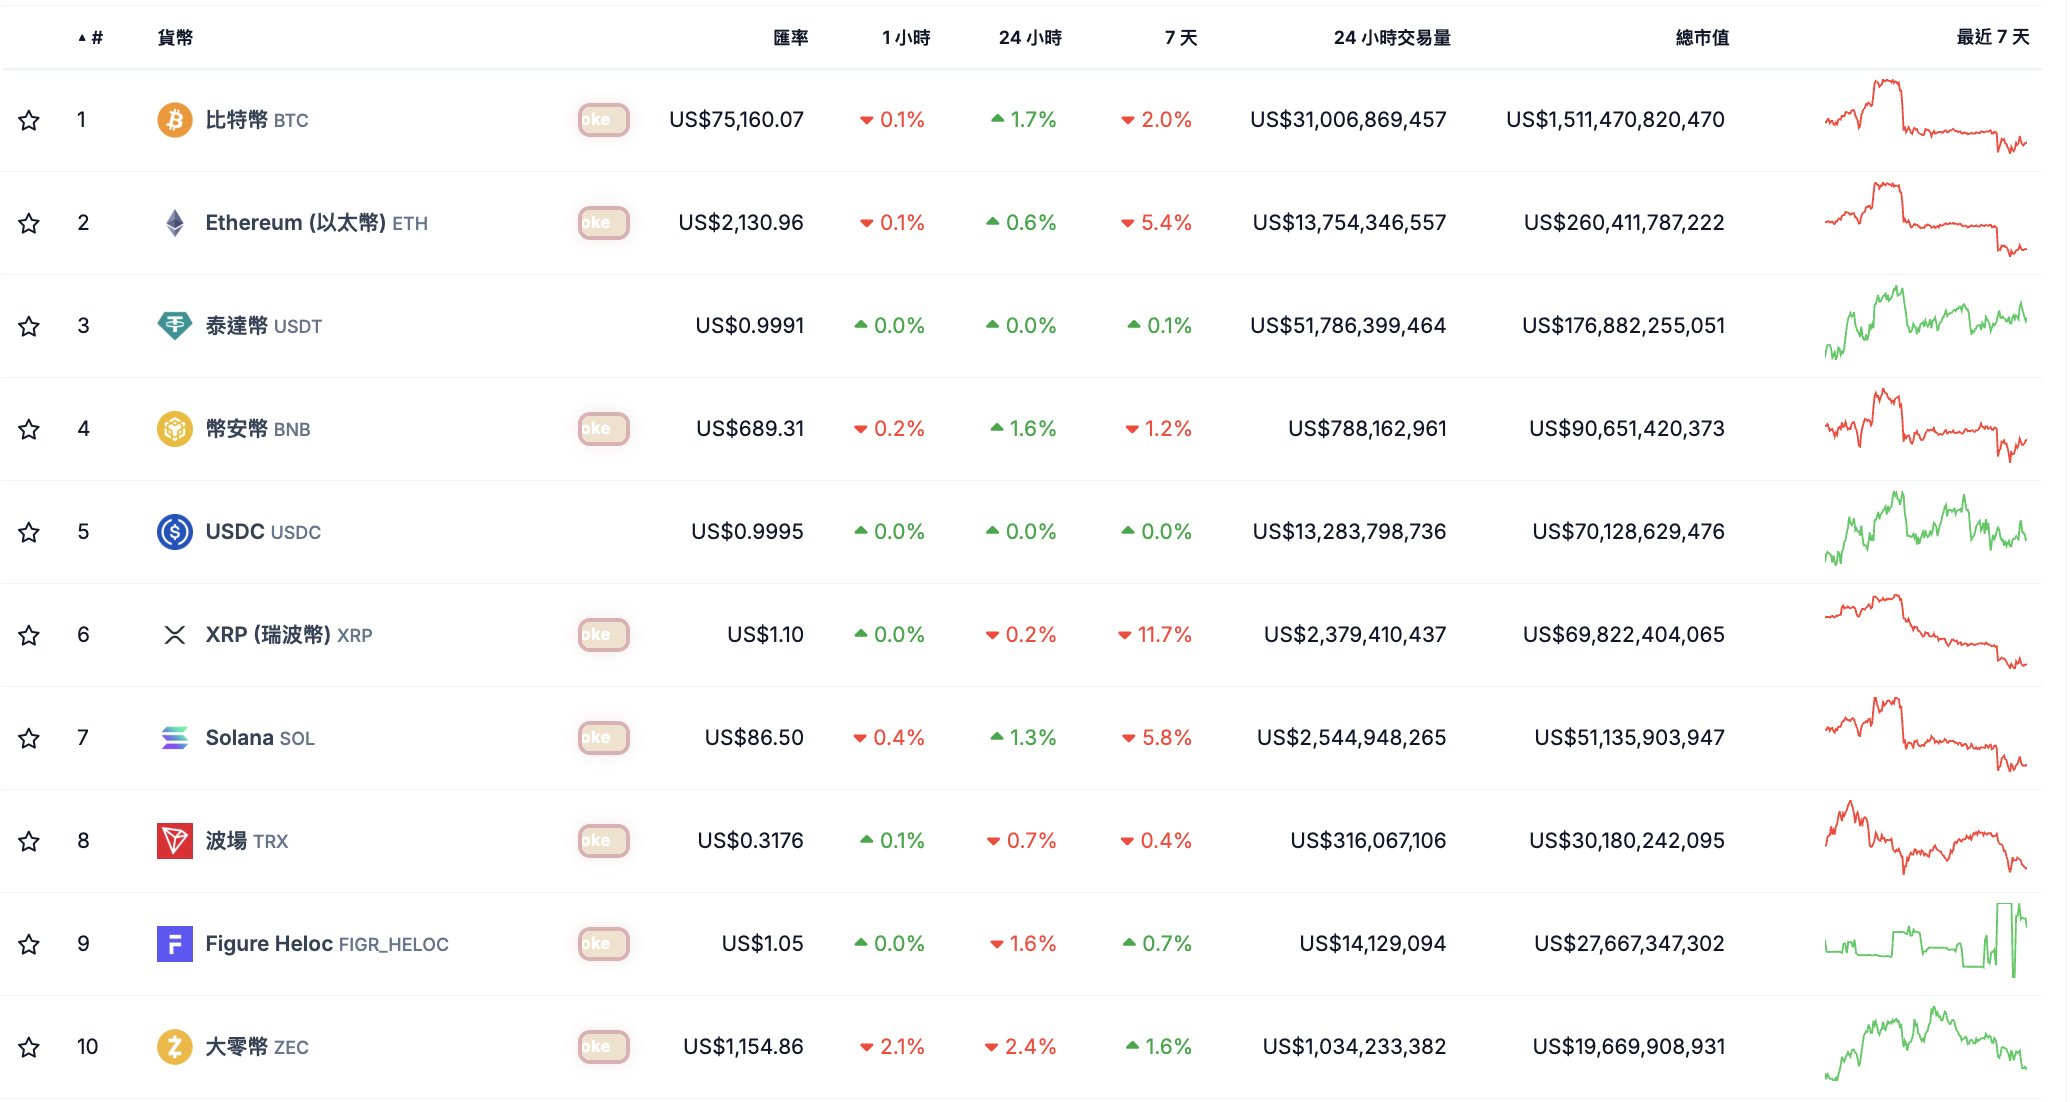 Image source: CoinGecko. Bitcoin recovered to around $75,160, up 1.7% over the past 24 hours but still down 9.4% over the past month. Ether was trading at around $2,131.
Over $1.15 billion in liquidations in 24 hours, with long positions bearing the brunt
According to a report by The Block yesterday, total cryptocurrency liquidations over the past 24 hours exceeded $1.15 billion, including about $1.04 billion in long positions and approximately $117 million in short positions. A total of 167,764 traders were affected.
By cryptocurrency, Ether liquidations exceeded $500 million, while Bitcoin liquidations totaled about $309 million. The largest single liquidation occurred in the ETHUSDT trading pair on Binance, valued at approximately $48.2 million.
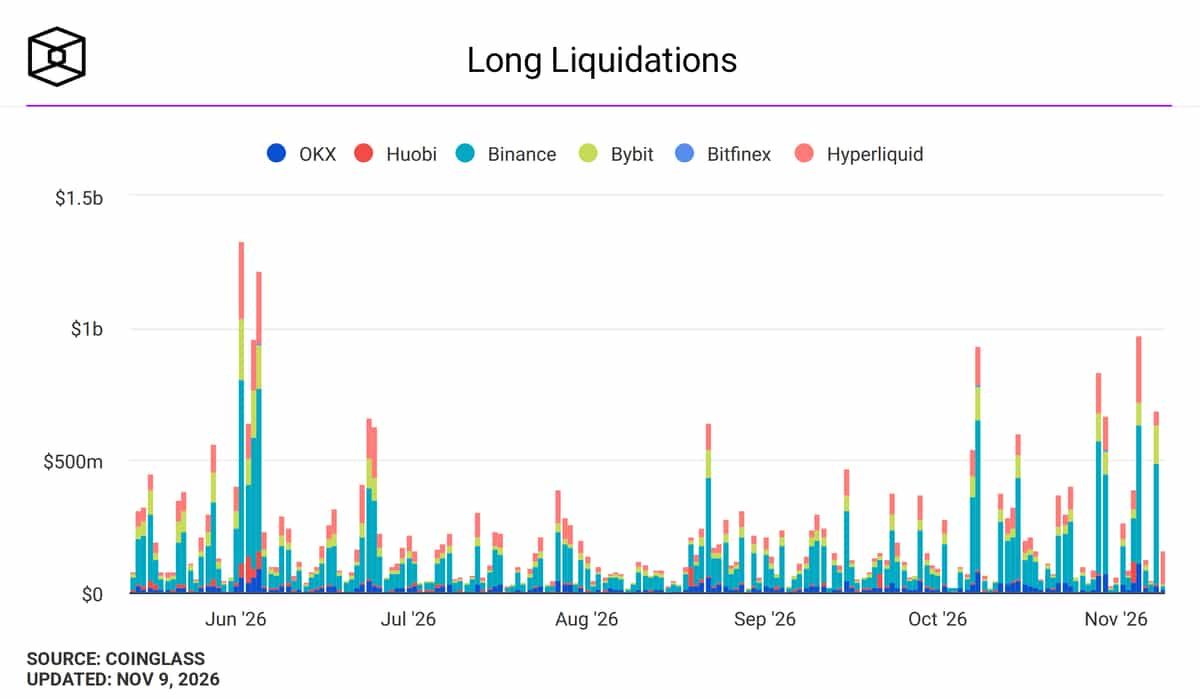 Image source: The Block. According to a report by The Block yesterday, total cryptocurrency liquidations over the past 24 hours exceeded $1.15 billion.
The large number of liquidated long positions reflects the impact of falling prices on leveraged positions that had built up in the market. When prices reach traders’ liquidation thresholds, exchanges automatically sell the relevant positions, potentially amplifying market volatility over a short period.
It is worth noting that liquidation figures are calculated on a rolling 24-hour basis and change over time. As of this morning (November 10), CoinGlass showed that the latest 24-hour liquidation total had fallen to around $293 million, involving 83,096 traders, with long positions accounting for 63.9%.
This means the peak of the previous wave of concentrated liquidations has gradually moved out of the latest reporting window. The earlier figure of more than $1 billion in liquidations should not be taken as a direct reflection of current market conditions.
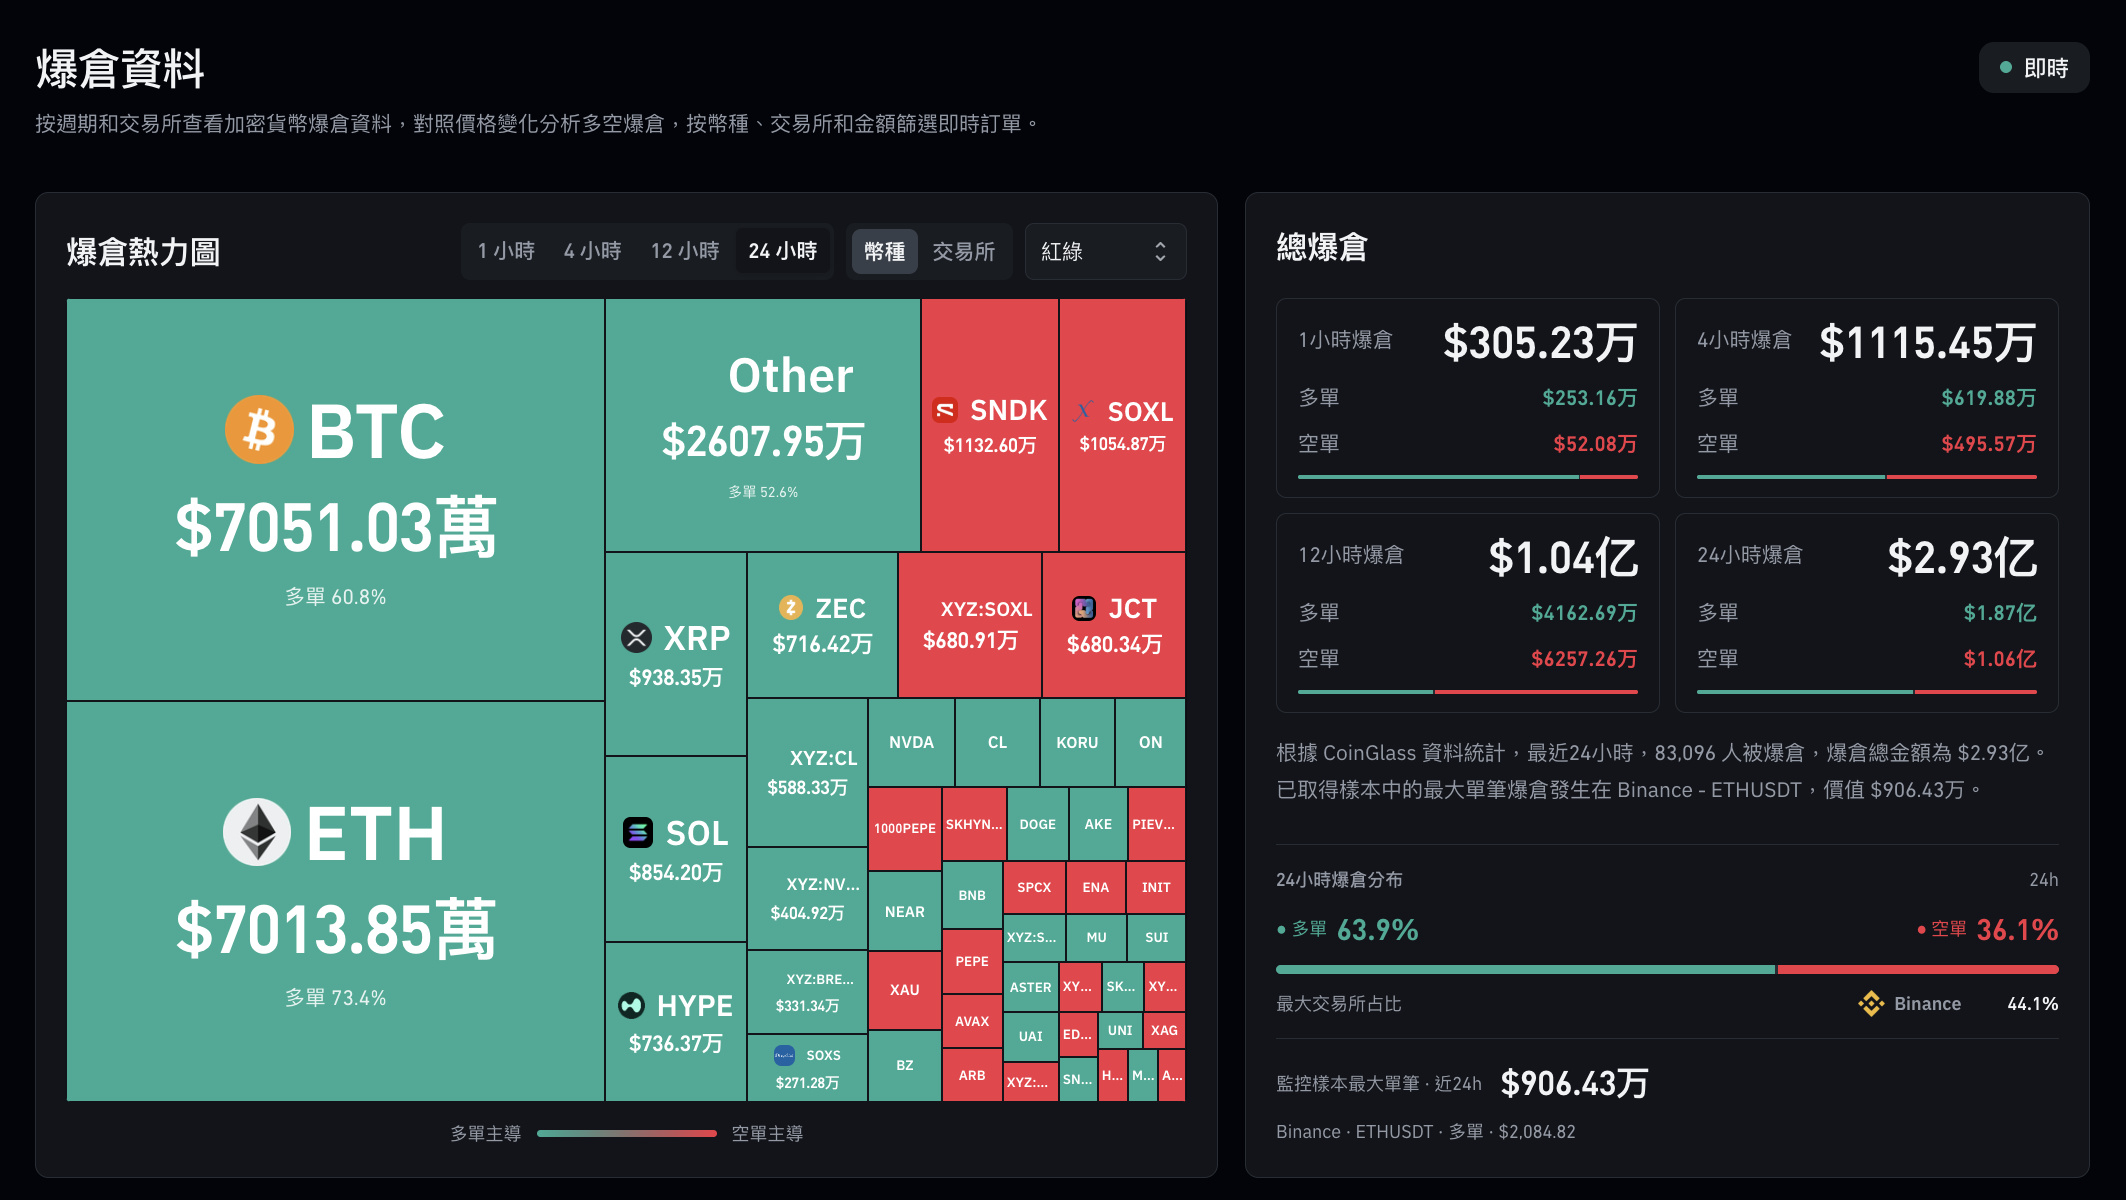 Image source: CoinGlass. As of this morning (November 10), CoinGlass showed that the latest 24-hour liquidation total had fallen to around $293 million.
BTC falls below 50-week moving average as analysts watch $75,500 resistance
In addition to its short-term price decline, Bitcoin has also fallen below a long-term technical indicator that has drawn market attention. Alex Thorn, head of research at Galaxy, wrote on X that Bitcoin’s weekly close on November 8 fell below its 50-week moving average, ending a seven-week streak above the indicator. It was also the first weekly close below the moving average since September.
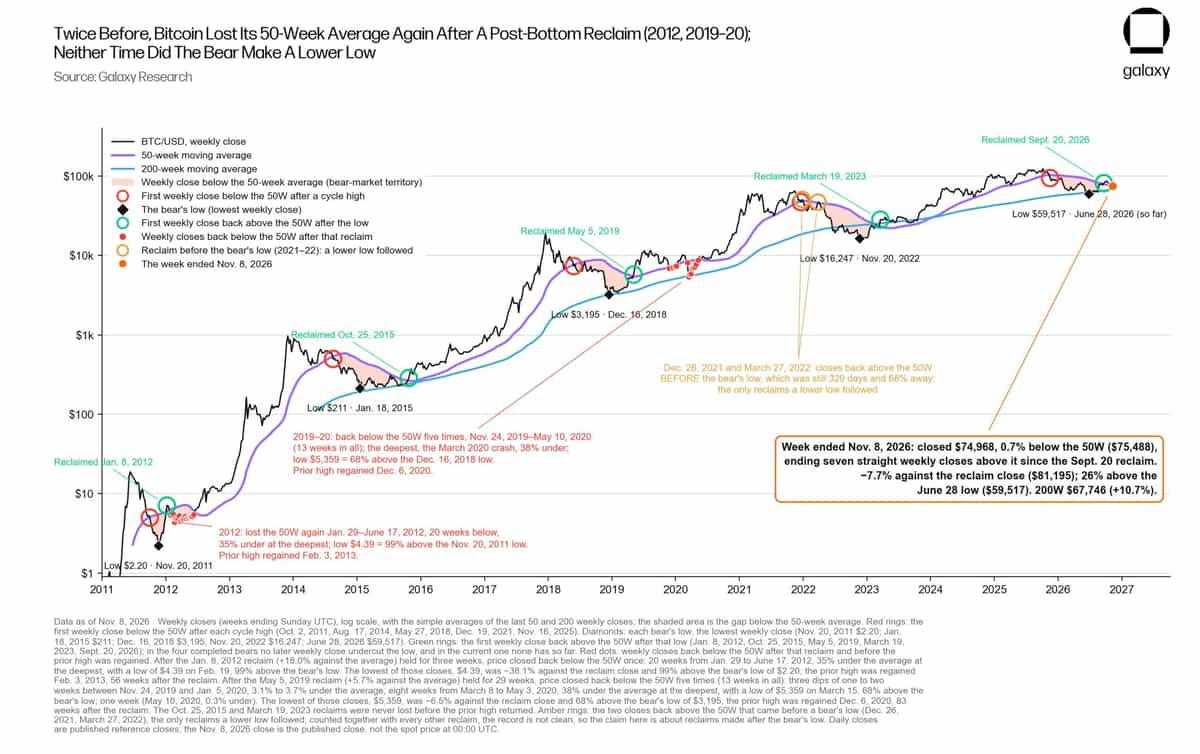 Image source: X/@intangiblecoins. Alex Thorn, head of research at Galaxy, wrote on X that Bitcoin’s weekly close on November 8 fell below its 50-week moving average, ending a seven-week streak above the indicator.
He noted that Bitcoin’s 50-week moving average was around $75,488 at the time, while the weekly closing price was approximately 0.7% below that level.
Looking back at market performance in 2011–2012 and 2019–2020, Thorn noted that Bitcoin had previously fallen back below its 50-week moving average after reclaiming it, then entered a prolonged period of consolidation. He believes that if BTC can move back above this moving average within a month, the recovery outlook he previously outlined may still hold.
Meanwhile, CoinDesk reported that Bitcoin’s latest decline briefly reached around $73,761, bringing it close to the 200-day moving average, which was around $73,151 at the time.
Blockchain analytics firm Glassnode estimates that the average cost basis for short-term holders is around $75,700. If Bitcoin remains below that level, some investors who entered the market recently may face unrealized losses, increasing selling pressure.
ETF outflows continue as U.S. inflation data take center stage
Bitcoin’s decline also came amid weakening demand for U.S. spot ETFs. According to Farside Investors, U.S. spot Bitcoin ETFs saw combined net outflows of about $1.282 billion from November 2 to 6, their largest weekly outflow since June. This also turned cumulative flows for 2026 into net outflows of about $914 million.
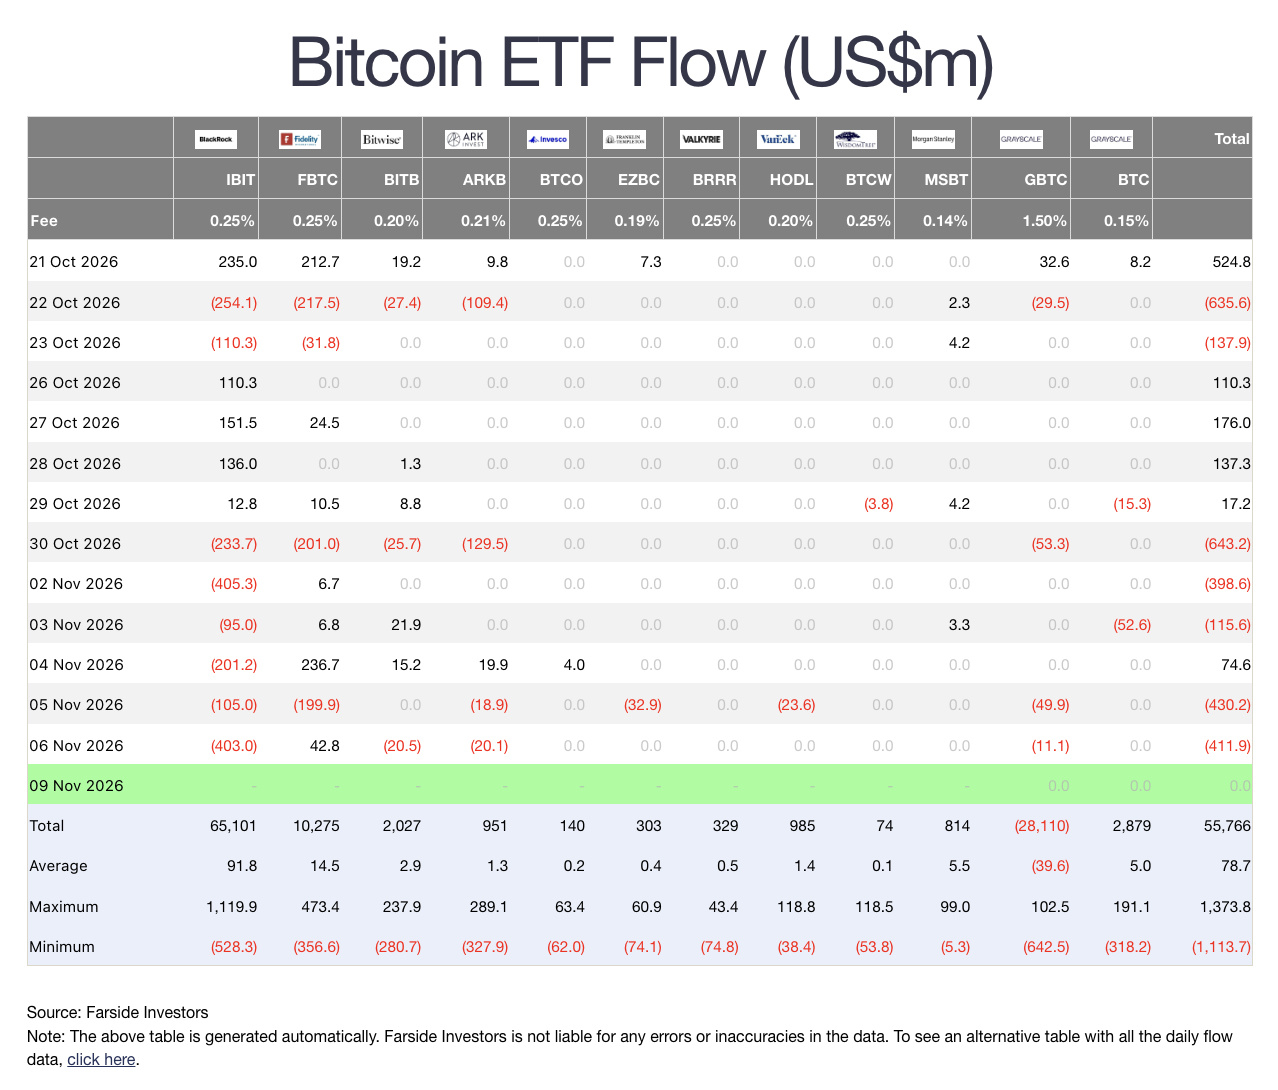 Image source: Farside Investors. U.S. spot Bitcoin ETFs saw combined net outflows of about $1.282 billion, their largest weekly outflow since June.
CoinDesk reported that Bitcoin’s recent rebound has lacked steady spot-market buying support, and the anticipated return of ETF inflows has yet to materialize.
Investors are also closely watching the U.S. Federal Reserve’s (Fed) interest rate policy. According to CME FedWatch data from November 9, the market-implied probability of a 25-basis-point rate hike at the Fed’s December meeting rose to 84%, while the probability of rates remaining unchanged stood at 16%, indicating that traders have become more cautious about the monetary policy outlook.
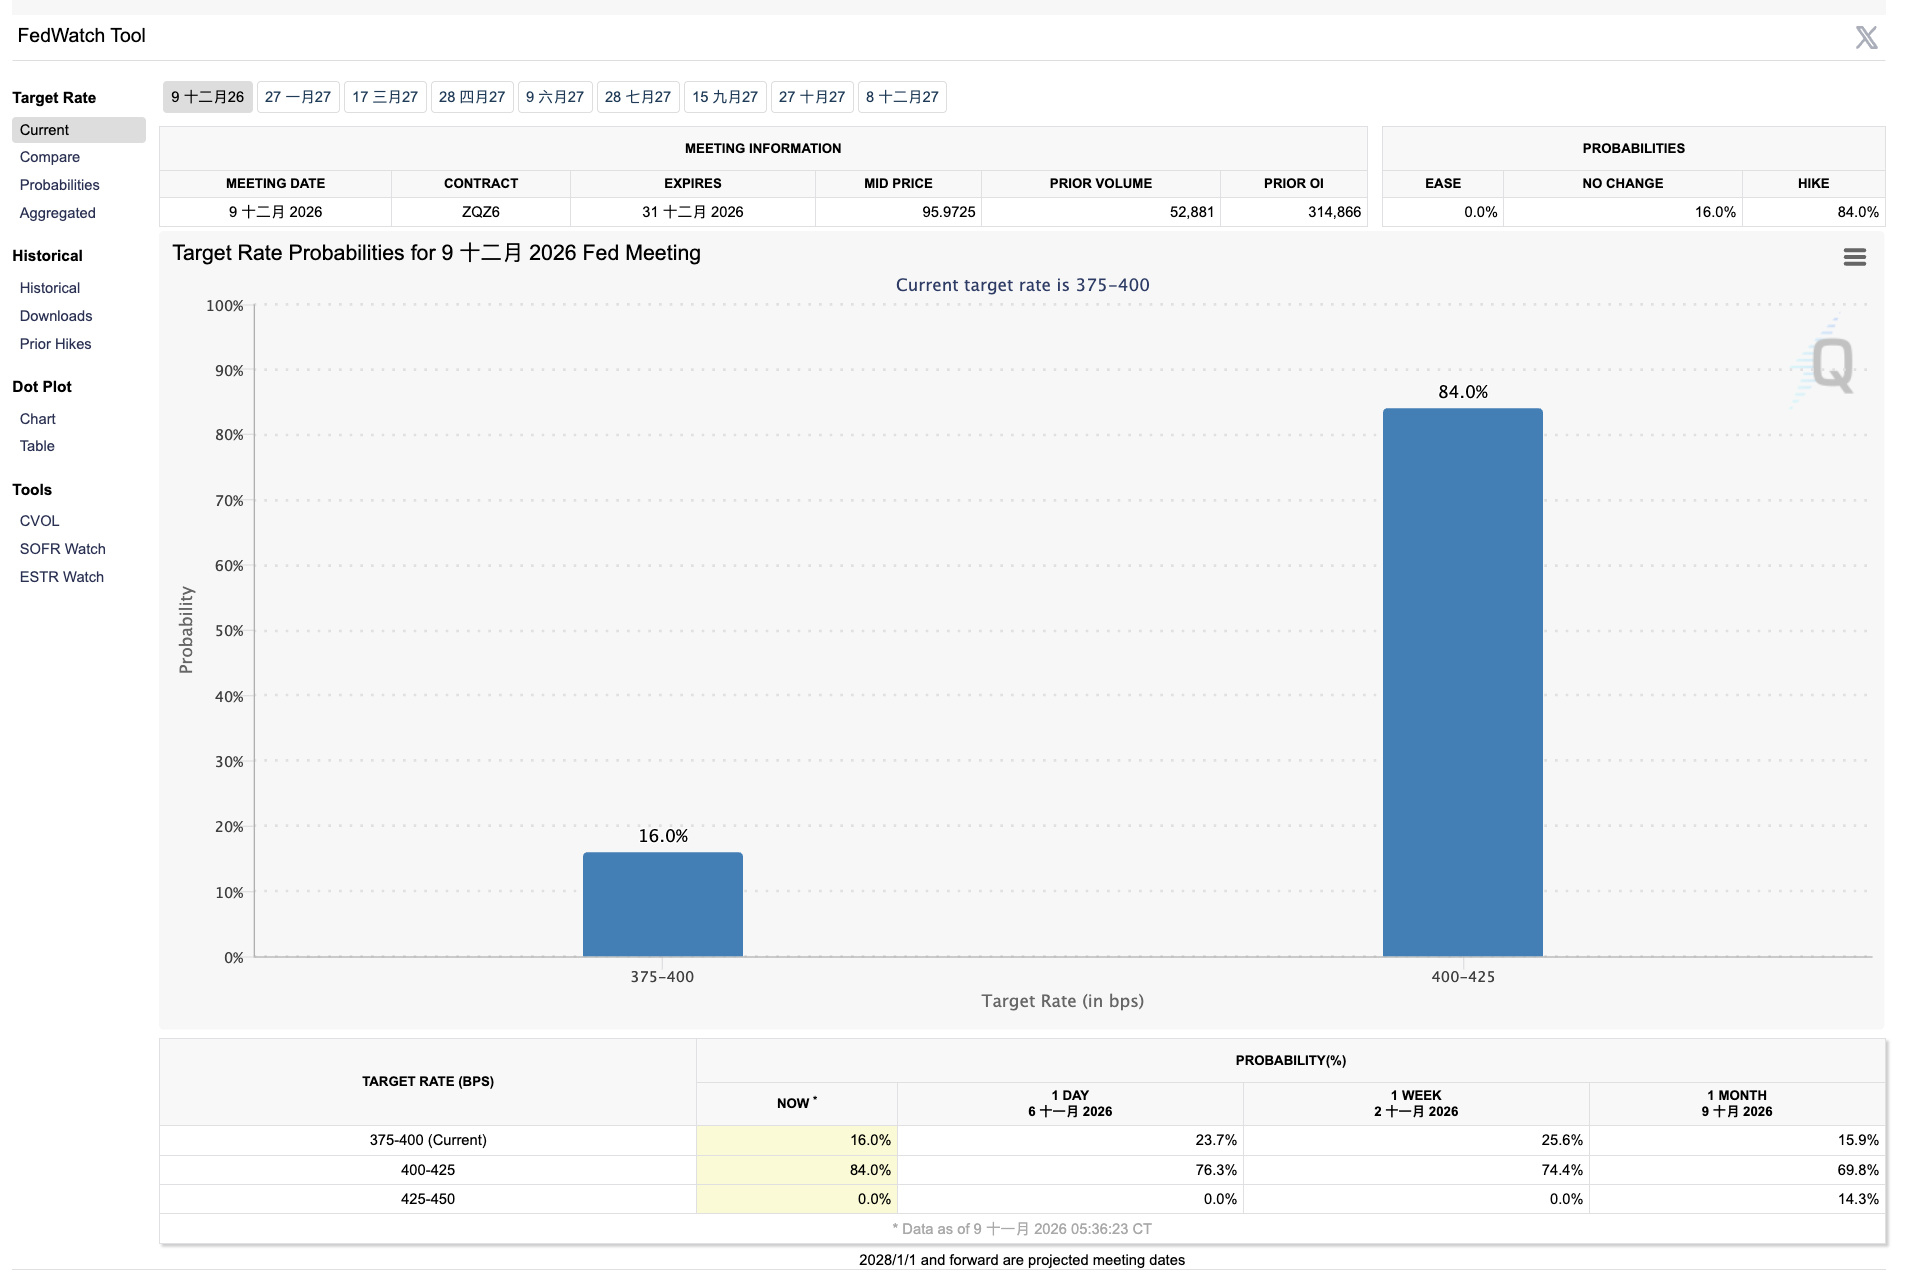 Image source: CME FedWatch Tool. According to CME FedWatch data from November 9, the market-implied probability of a rate hike at the Fed’s December meeting rose to 84%.
The U.S. is expected to release its October Consumer Price Index (CPI) on November 10 and its Producer Price Index (PPI) on November 13. These two reports will influence market expectations for the future path of interest rates.
Notably, U.S. stocks rebounded sharply on November 9, with the S&P 500 rising 2.35% and the Nasdaq gaining 2.74%. Bitcoin, however, continued to fluctuate around $75,000, indicating that buying demand in the cryptocurrency market has yet to recover in tandem.
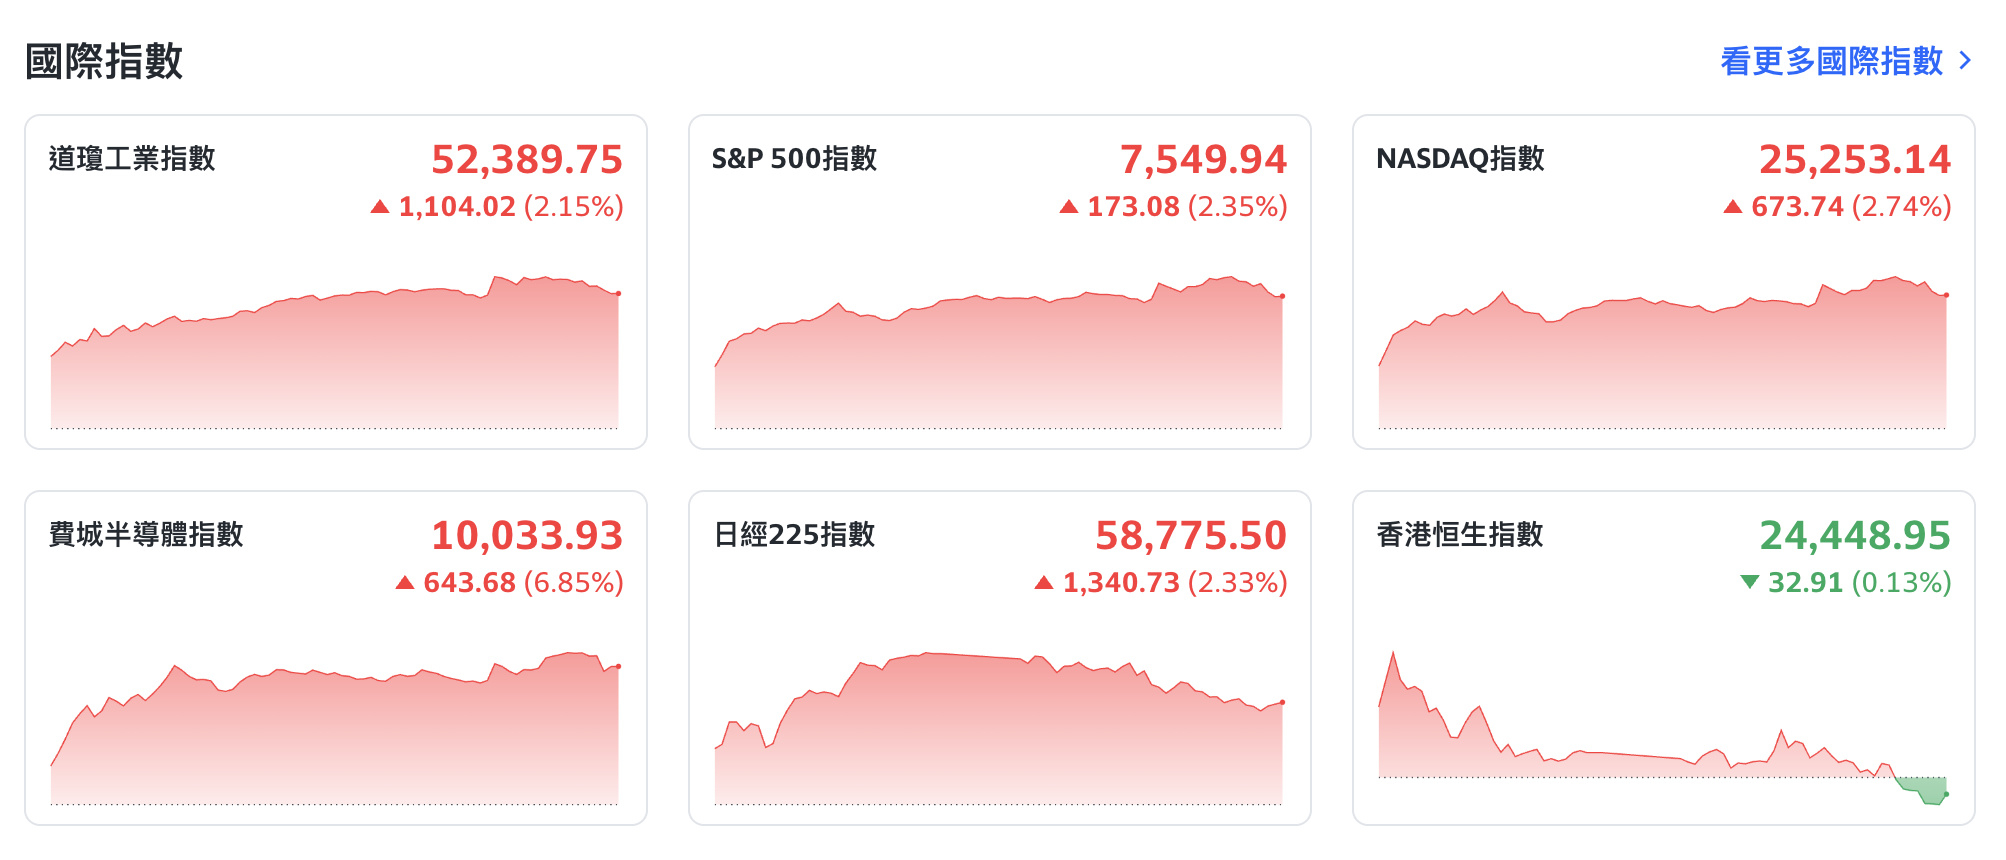 Image source: Yahoo Finance. U.S. stocks rebounded sharply on November 9, with the S&P 500 rising 2.35% and the Nasdaq gaining 2.74%.
In the short term, the market will be watching to see whether Bitcoin can regain and hold the $75,500–$75,700 range, as well as the technical support near $73,000. ETF fund flows and U.S. inflation data will remain important factors affecting price movements.
This article, “Bitcoin Falls Below $74,000! Over $1 Billion in Liquidations Across the Market, Losing the Key 50-Week Moving Average,” was first published by “Crypto City.”