BTC: Percent of Supply in Profit
The share of profitable coins across the network has fallen back into the “recovery zone”; most coins have yet to return to highly crowded levels.
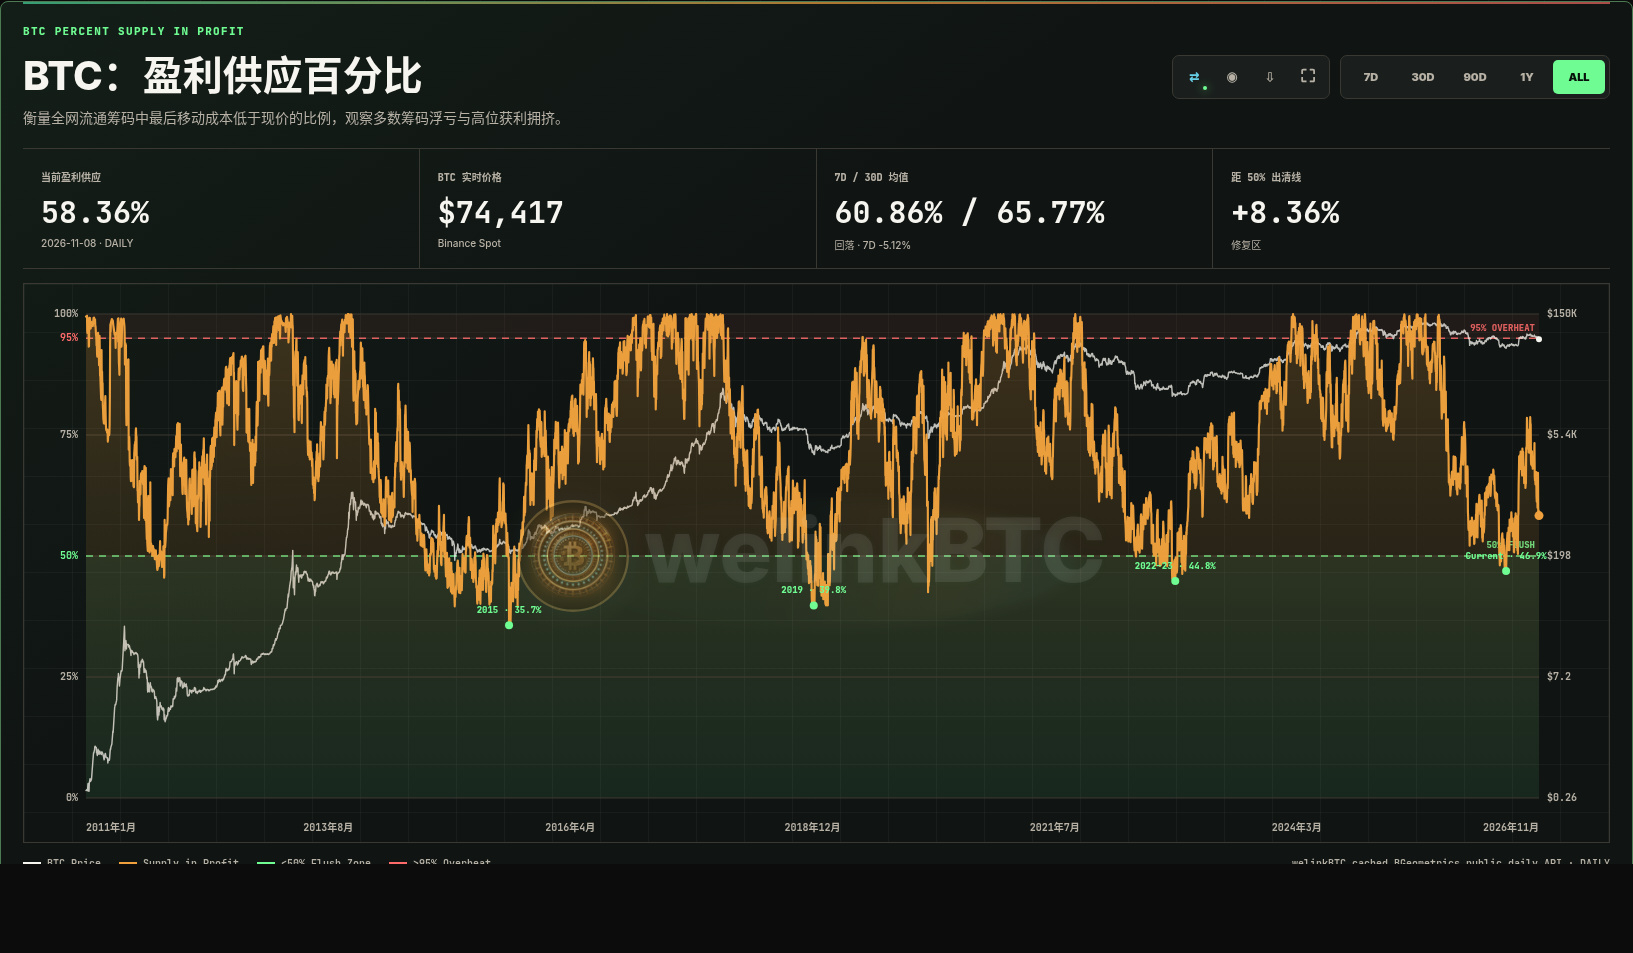
As of the daily reading for 2026-11-08, the percent of supply in profit is 58.36%, within the 50%–65% recovery zone. The 7-day and 30-day averages are 60.86% and 65.77%, respectively, with a 7-day change of about -5.12%. The current reading is still about 8.36 percentage points above the 50% capitulation line. This corresponds to approximately 11.73M BTC in profit and 8.37M BTC in loss.
How should you read this indicator? It measures the share of circulating bitcoin whose price at its last on-chain movement was below the current price: the higher the percentage, the more crowded profitable positions are; the lower it is, the more widespread unrealized losses and capitulation pressure become. The page marks below 50% as the bottom capitulation watch zone, 50%–65% as the recovery zone, 65%–95% as the normal profit zone, and ≥95% as the overheated top watch zone. Historical deep lows were roughly 36% in 2015, 39% in 2019, and 45% in 2022–23. In the current cycle, readings of around 46%–47% were seen near 58.5K.
A recovery from below 50% indicates that extreme unrealized losses are easing, but a single reading cannot confirm an absolute bottom and is not, by itself, a buy or sell signal. A more robust assessment of the cycle still requires looking at spot demand, realized price, long-term holder behavior, and global liquidity together.
More curated on-chain cycle indicators
Portal: https://welinkbtc-onchainmain.xyz/
Understand market cycles like a professional analyst
$BTC
The share of profitable coins across the network has fallen back into the “recovery zone”; most coins have yet to return to highly crowded levels.
As of the daily reading for 2026-11-08, the percent of supply in profit is 58.36%, within the 50%–65% recovery zone. The 7-day and 30-day averages are 60.86% and 65.77%, respectively, with a 7-day change of about -5.12%. The current reading is still about 8.36 percentage points above the 50% capitulation line. This corresponds to approximately 11.73M BTC in profit and 8.37M BTC in loss.
How should you read this indicator? It measures the share of circulating bitcoin whose price at its last on-chain movement was below the current price: the higher the percentage, the more crowded profitable positions are; the lower it is, the more widespread unrealized losses and capitulation pressure become. The page marks below 50% as the bottom capitulation watch zone, 50%–65% as the recovery zone, 65%–95% as the normal profit zone, and ≥95% as the overheated top watch zone. Historical deep lows were roughly 36% in 2015, 39% in 2019, and 45% in 2022–23. In the current cycle, readings of around 46%–47% were seen near 58.5K.
A recovery from below 50% indicates that extreme unrealized losses are easing, but a single reading cannot confirm an absolute bottom and is not, by itself, a buy or sell signal. A more robust assessment of the cycle still requires looking at spot demand, realized price, long-term holder behavior, and global liquidity together.
More curated on-chain cycle indicators
Portal: https://welinkbtc-onchainmain.xyz/
Understand market cycles like a professional analyst
$BTC