For Bitcoin, I’m leaning toward an accelerated decline on the higher timeframes. On the 4h chart, the key thing to watch is whether it can reclaim 76,000.
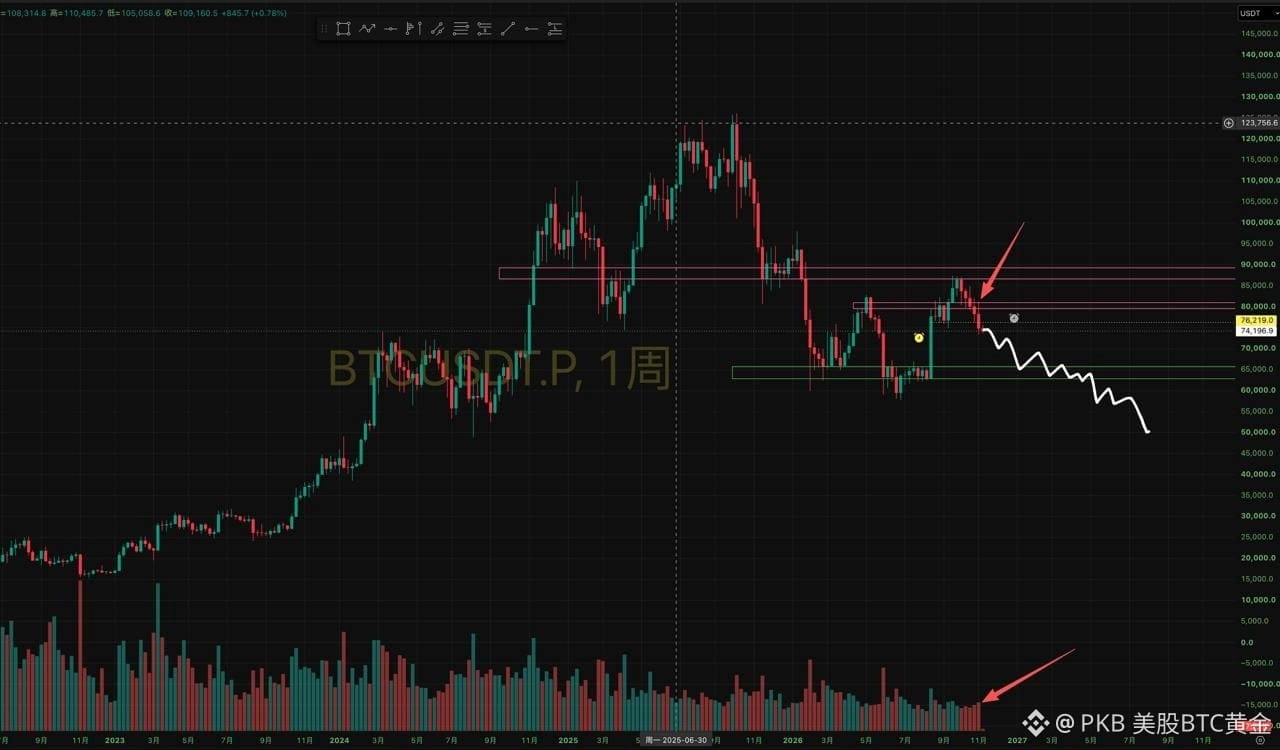
The weekly chart has now posted five consecutive down weeks, and volume is still gradually increasing, indicating growing selling pressure. Price has decisively broken below the key weekly support at 76,000, and I think the weekly decline is about to accelerate.
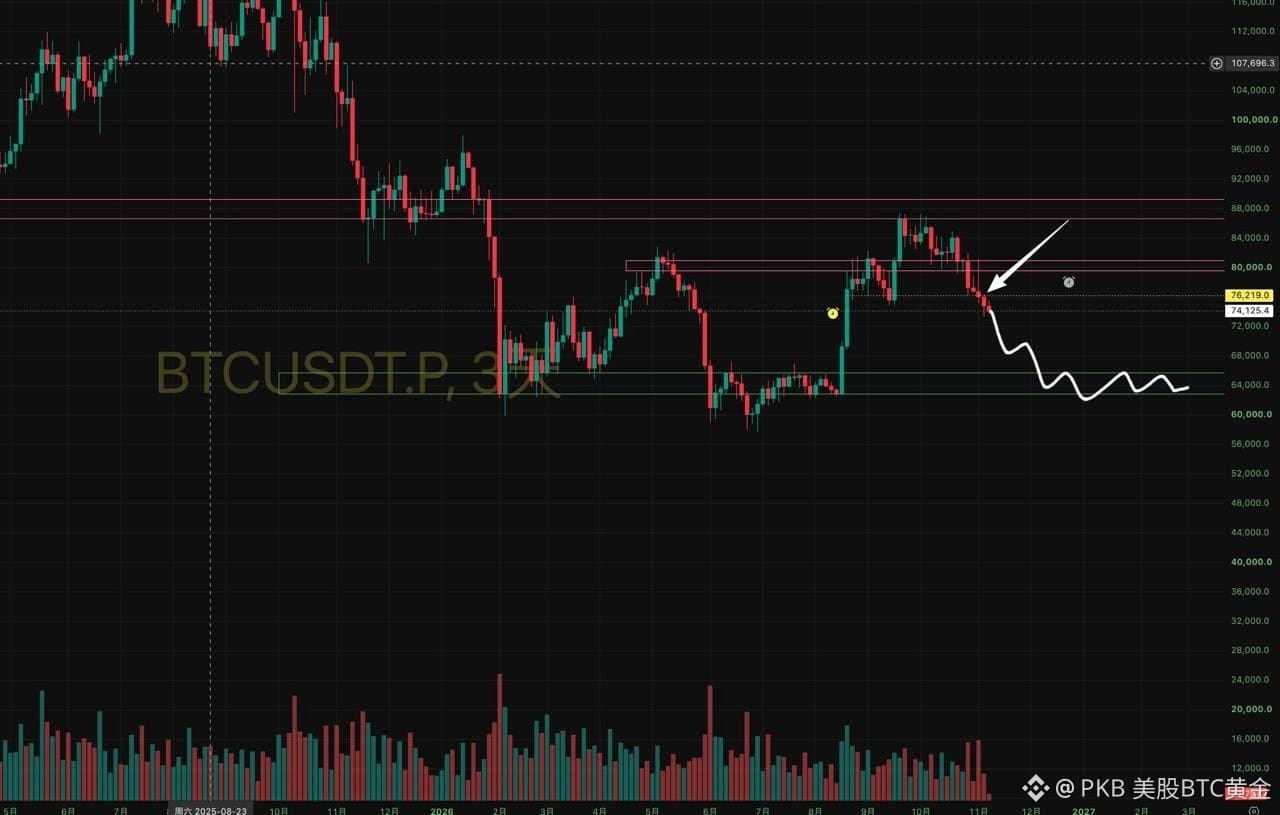
The 3-day chart is also seeing consecutive high-volume bearish candles driving price down below 76,000. I think this timeframe is also likely to accelerate downward, testing the 60,000–65,000 range.
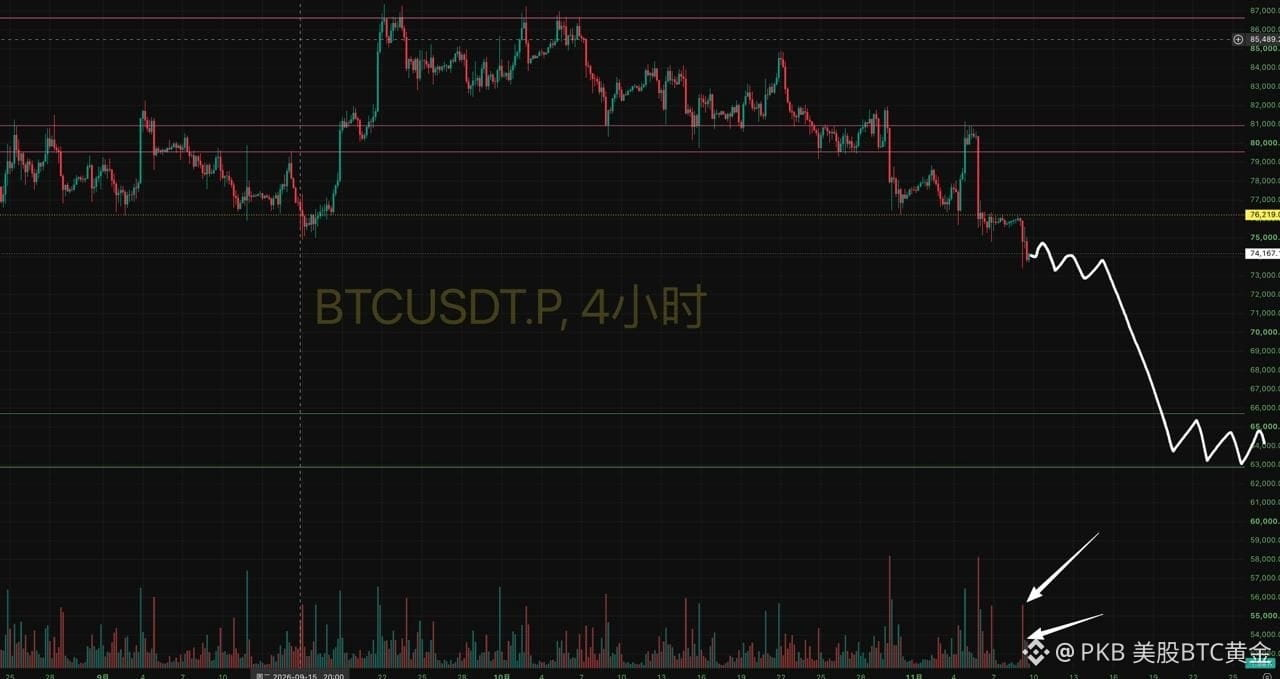
Today, the 4h chart broke below key support on high volume, but there was no particularly strong demand. I think this counts as a confirmed breakdown. If the 4h chart reclaims 76,000, there’s a fairly high chance of another sharp upward wick to test the top of the daily range around 80,000. If price consolidates here and then continues lower, that would signal an accelerating decline.
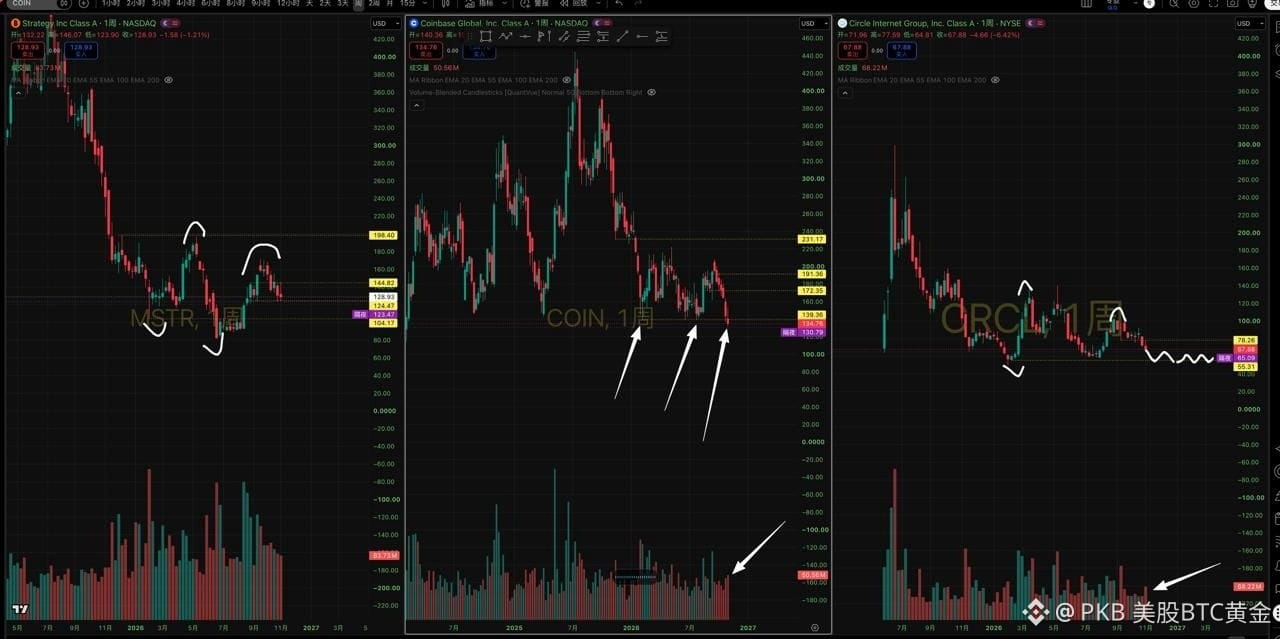
Related stocks also look weak on the weekly chart: MSTR remains in a downtrend, with lower lows and lower highs; COIN has decisively broken below key support at 139; CRCL’s rebound highs are gradually declining, and it will most likely retest the area around 55, possibly even breaking below 55.
Overall, I think an accelerated decline on the higher timeframes is about to begin. There’s a fairly high chance price will test the bottom of the range again, and may even break below 57,500 once more.
#BTC
X:print_kbar
The weekly chart has now posted five consecutive down weeks, and volume is still gradually increasing, indicating growing selling pressure. Price has decisively broken below the key weekly support at 76,000, and I think the weekly decline is about to accelerate.
The 3-day chart is also seeing consecutive high-volume bearish candles driving price down below 76,000. I think this timeframe is also likely to accelerate downward, testing the 60,000–65,000 range.
Today, the 4h chart broke below key support on high volume, but there was no particularly strong demand. I think this counts as a confirmed breakdown. If the 4h chart reclaims 76,000, there’s a fairly high chance of another sharp upward wick to test the top of the daily range around 80,000. If price consolidates here and then continues lower, that would signal an accelerating decline.
Related stocks also look weak on the weekly chart: MSTR remains in a downtrend, with lower lows and lower highs; COIN has decisively broken below key support at 139; CRCL’s rebound highs are gradually declining, and it will most likely retest the area around 55, possibly even breaking below 55.
Overall, I think an accelerated decline on the higher timeframes is about to begin. There’s a fairly high chance price will test the bottom of the range again, and may even break below 57,500 once more.
#BTC
X:print_kbar