#链上指标分析
BTC Realized Profit/Loss Ratio Momentum (RPLR-M)
Are we entering a new cycle after 11 months of bear-market pressure release?
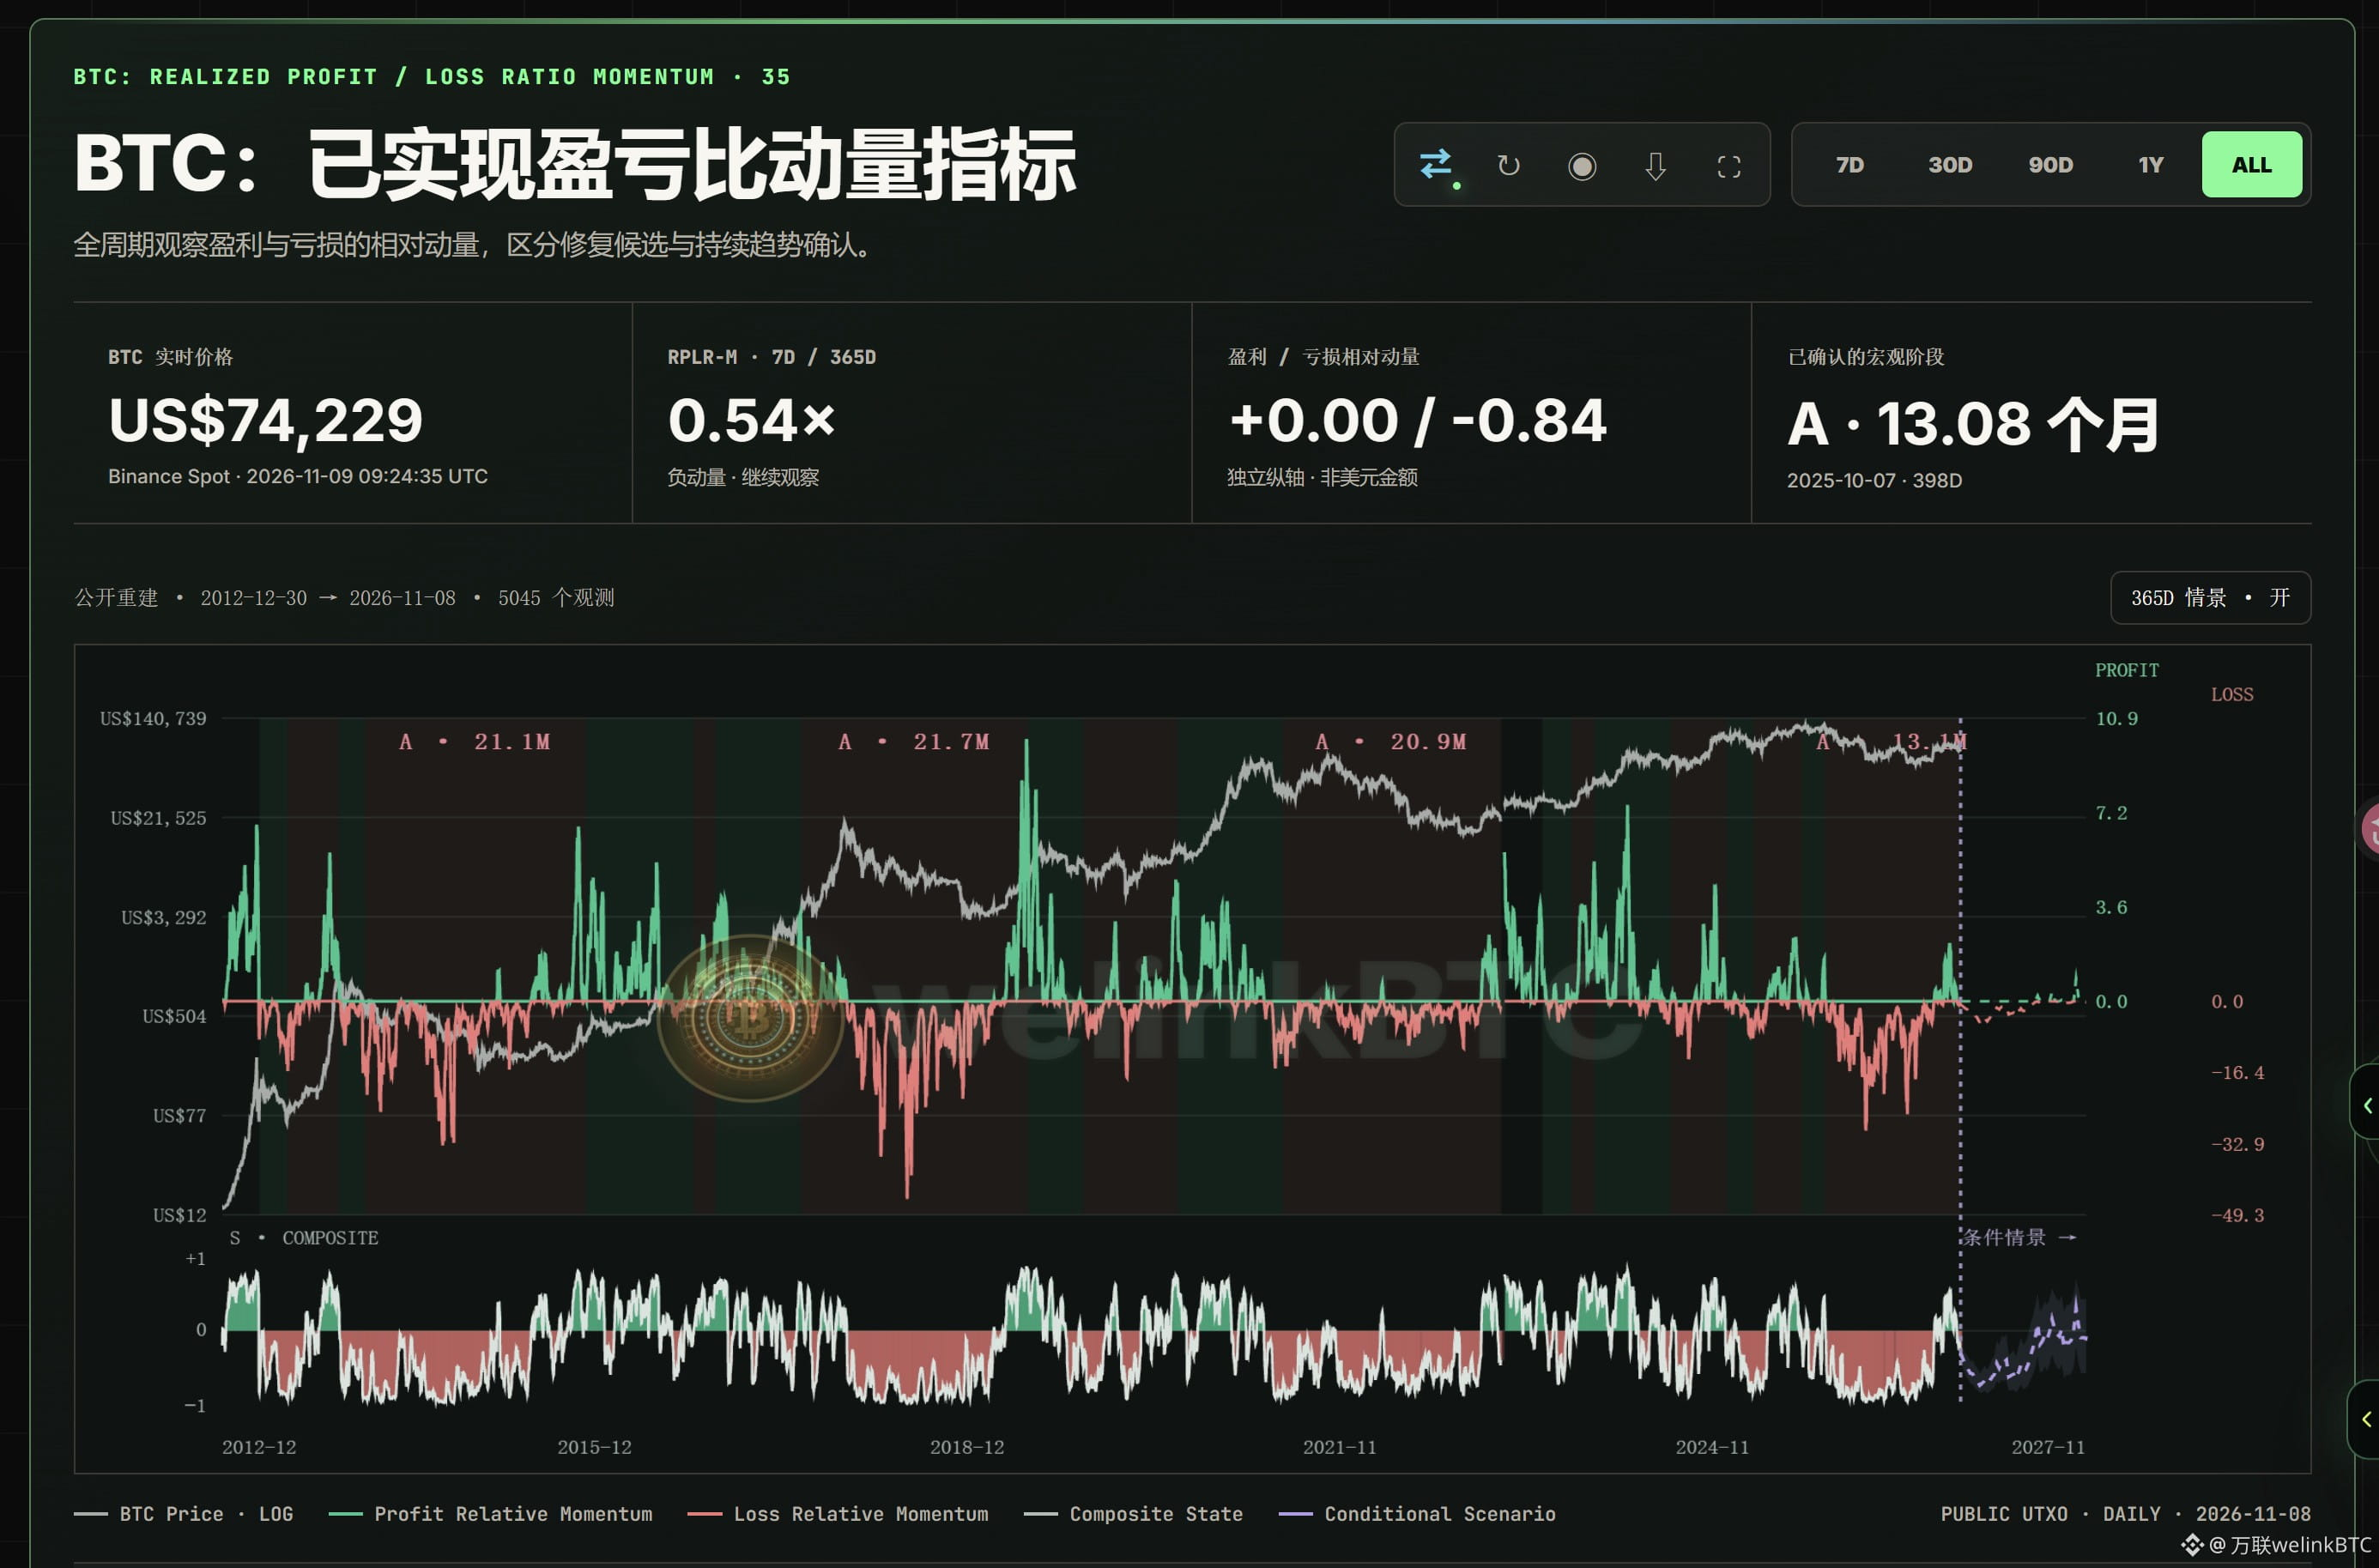
This chart is showing early signs of a relatively positive cyclical recovery,
but for now, it is more appropriate to describe this as waning bear-market momentum and renewed dominance of profit momentum,
rather than to conclude that a bull market has begun.
Looking at the historical comparisons in the chart,
the most valuable insight is not any single bottom in the red line or spike in the green line,
but three consecutive developments:
1. Loss momentum was released in a concentrated burst early in the bear market, then gradually weakened.
2. Negative momentum persisted for about 11 months, a duration close to that of the previous two full bear markets.
3. The bottom-state indicator turned green again, suggesting that the relative balance between profit and loss momentum is beginning to improve.
However,
a recovery in momentum does not mean that absolute losses have disappeared,
nor does it mean that the price cannot make new lows.
The most important change in this bear market: loss momentum is waning
Looking at Area A from late 2025 through 2026, the indicator’s changes can be divided into three stages.
Stage 1: Loss momentum is released rapidly
After entering Area A in late 2025, the red curve expanded noticeably downward.
In early 2026, the red line plunged deeply several times, indicating that short-term losses were rising rapidly relative to the normal level of the past year.
Stage 2: Price remains weak, but the red line’s lows gradually rise
This is the most analytically significant development in the chart.
In the second half of 2026, BTC price remained volatile, and the red momentum line also fluctuated downward several times, but the deepest loss-momentum peaks were concentrated mainly in the early stages of the bear market.
Stage 3: The green line rises again, and conditions enter a recovery phase
Around September 2026, the composite state at the bottom of the chart turned positive, and green momentum began to reappear.
From October through November, the green curve also made a notable upward move.
This is a relatively positive signal:
the market is shifting from a period dominated by loss momentum to one in which profit momentum is recovering.
However, green momentum remains uneven for now,
and is nowhere near the sustained expansion seen during historically strong bull-market phases.
So the most accurate characterization of this cycle is:
the bear market’s negative-momentum phase may have ended,
but a new uptrend has yet to be sufficiently confirmed.
#比特币连续五周下跌 $BTC
BTC Realized Profit/Loss Ratio Momentum (RPLR-M)
Are we entering a new cycle after 11 months of bear-market pressure release?
This chart is showing early signs of a relatively positive cyclical recovery,
but for now, it is more appropriate to describe this as waning bear-market momentum and renewed dominance of profit momentum,
rather than to conclude that a bull market has begun.
Looking at the historical comparisons in the chart,
the most valuable insight is not any single bottom in the red line or spike in the green line,
but three consecutive developments:
1. Loss momentum was released in a concentrated burst early in the bear market, then gradually weakened.
2. Negative momentum persisted for about 11 months, a duration close to that of the previous two full bear markets.
3. The bottom-state indicator turned green again, suggesting that the relative balance between profit and loss momentum is beginning to improve.
However,
a recovery in momentum does not mean that absolute losses have disappeared,
nor does it mean that the price cannot make new lows.
The most important change in this bear market: loss momentum is waning
Looking at Area A from late 2025 through 2026, the indicator’s changes can be divided into three stages.
Stage 1: Loss momentum is released rapidly
After entering Area A in late 2025, the red curve expanded noticeably downward.
In early 2026, the red line plunged deeply several times, indicating that short-term losses were rising rapidly relative to the normal level of the past year.
Stage 2: Price remains weak, but the red line’s lows gradually rise
This is the most analytically significant development in the chart.
In the second half of 2026, BTC price remained volatile, and the red momentum line also fluctuated downward several times, but the deepest loss-momentum peaks were concentrated mainly in the early stages of the bear market.
Stage 3: The green line rises again, and conditions enter a recovery phase
Around September 2026, the composite state at the bottom of the chart turned positive, and green momentum began to reappear.
From October through November, the green curve also made a notable upward move.
This is a relatively positive signal:
the market is shifting from a period dominated by loss momentum to one in which profit momentum is recovering.
However, green momentum remains uneven for now,
and is nowhere near the sustained expansion seen during historically strong bull-market phases.
So the most accurate characterization of this cycle is:
the bear market’s negative-momentum phase may have ended,
but a new uptrend has yet to be sufficiently confirmed.
#比特币连续五周下跌 $BTC