The Psychology of a 214% Pump: Why Chasing Green Candles Can Be Dangerous
Imagine opening Binance Futures and seeing an asset up more than 200% in 24 hours.
Your first reaction might be excitement.
Your second might be fear of missing out.
That is exactly where traders need to slow down.
In the November 9 Binance USDⓈ-M Futures snapshot:
$JCT was up 214.92%.
$AIOT was up 29.38%.
$HOT was up 27.15%.
These numbers are attention-grabbing, but they don't tell the entire story.
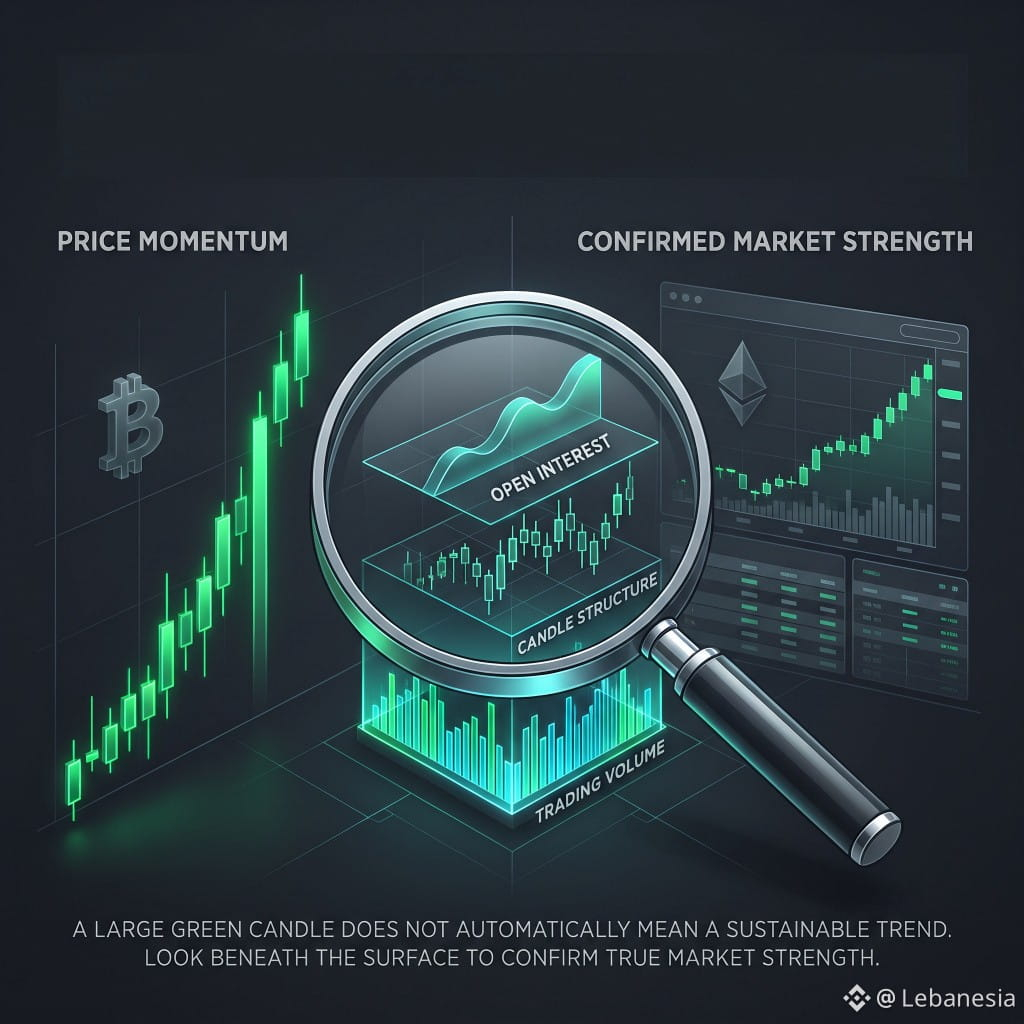
When an asset moves aggressively, I prefer to examine three things before drawing conclusions.
1. Volume: Is participation increasing?
Compare current trading volume with its recent average.
A price rally accompanied by increasing volume may indicate stronger market participation.
However, high volume alone does not guarantee that buyers are in control.
2. Candlestick structure: Are buyers defending higher prices?
Pay attention to candle closes and upper wicks.
A candle closing near its high can show stronger buying pressure than one that repeatedly rejects higher prices.
But a single candle is never enough to confirm a trend.
3. Open interest: Are new Futures positions entering?
Rising open interest indicates that the number of outstanding contracts is increasing.
But it does not automatically mean that new bullish positions are dominating.
You still need price action, funding data, and market context.
One important lesson:
The bigger the candle, the more important it becomes to understand the risk of entering late.
Sometimes the best trading decision is simply to wait for better information.
Data limitation: Today's screenshot provides last prices and 24-hour percentage changes, but not verified volume, OHLCV candles, or open-interest figures. No technical breakout or momentum confirmation is being claimed.
Disclaimer: This is educational content, not a trading signal or financial advice. Futures markets involve substantial risk.
#TradingPsychology #VolumeAnalysis #TechnicalAnalysis #BinanceFutures #CryptoEducation
Imagine opening Binance Futures and seeing an asset up more than 200% in 24 hours.
Your first reaction might be excitement.
Your second might be fear of missing out.
That is exactly where traders need to slow down.
In the November 9 Binance USDⓈ-M Futures snapshot:
$JCT was up 214.92%.
$AIOT was up 29.38%.
$HOT was up 27.15%.
These numbers are attention-grabbing, but they don't tell the entire story.
When an asset moves aggressively, I prefer to examine three things before drawing conclusions.
1. Volume: Is participation increasing?
Compare current trading volume with its recent average.
A price rally accompanied by increasing volume may indicate stronger market participation.
However, high volume alone does not guarantee that buyers are in control.
2. Candlestick structure: Are buyers defending higher prices?
Pay attention to candle closes and upper wicks.
A candle closing near its high can show stronger buying pressure than one that repeatedly rejects higher prices.
But a single candle is never enough to confirm a trend.
3. Open interest: Are new Futures positions entering?
Rising open interest indicates that the number of outstanding contracts is increasing.
But it does not automatically mean that new bullish positions are dominating.
You still need price action, funding data, and market context.
One important lesson:
The bigger the candle, the more important it becomes to understand the risk of entering late.
Sometimes the best trading decision is simply to wait for better information.
Data limitation: Today's screenshot provides last prices and 24-hour percentage changes, but not verified volume, OHLCV candles, or open-interest figures. No technical breakout or momentum confirmation is being claimed.
Disclaimer: This is educational content, not a trading signal or financial advice. Futures markets involve substantial risk.
#TradingPsychology #VolumeAnalysis #TechnicalAnalysis #BinanceFutures #CryptoEducation