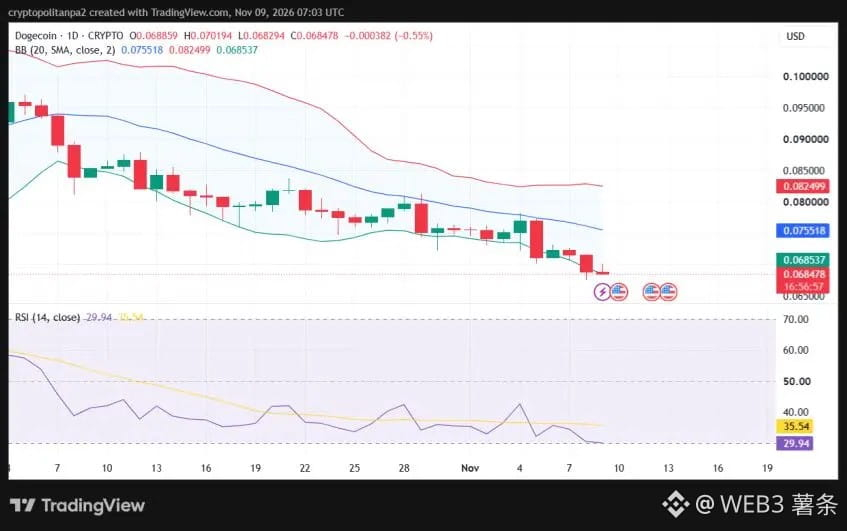
#DOGE Selling pressure has continued to build recently, and the daily chart has remained weak. Over the past 24 hours, DOGE fell further to $0.0684, closing the day with a red candlestick, which indicates that sellers remain in control.
Key support and resistance levels:
Support: $0.0685, near the lower Bollinger Band. If the price breaks below this level, it may remain under further pressure.
First resistance: $0.0723.
Second resistance: $0.0769.
From a technical perspective, the gap between the upper and lower Bollinger Bands has widened, indicating a marked increase in recent price volatility. Meanwhile, the RSI (Relative Strength Index) has fallen to 29, entering oversold territory.
In short, Dogecoin remains in a clear downtrend. The RSI entering oversold territory suggests there may be a chance of a short-term rebound, but it does not mean the price will necessarily rise right away. If selling pressure persists, DOGE could continue to fall.
Key support and resistance levels:
Support: $0.0685, near the lower Bollinger Band. If the price breaks below this level, it may remain under further pressure.
First resistance: $0.0723.
Second resistance: $0.0769.
From a technical perspective, the gap between the upper and lower Bollinger Bands has widened, indicating a marked increase in recent price volatility. Meanwhile, the RSI (Relative Strength Index) has fallen to 29, entering oversold territory.
In short, Dogecoin remains in a clear downtrend. The RSI entering oversold territory suggests there may be a chance of a short-term rebound, but it does not mean the price will necessarily rise right away. If selling pressure persists, DOGE could continue to fall.