If you’re a trend trader like me, turn off countertrend signals. You’ll miss out on chances to buy the bottom or sell the top, but you can often find the best entries.
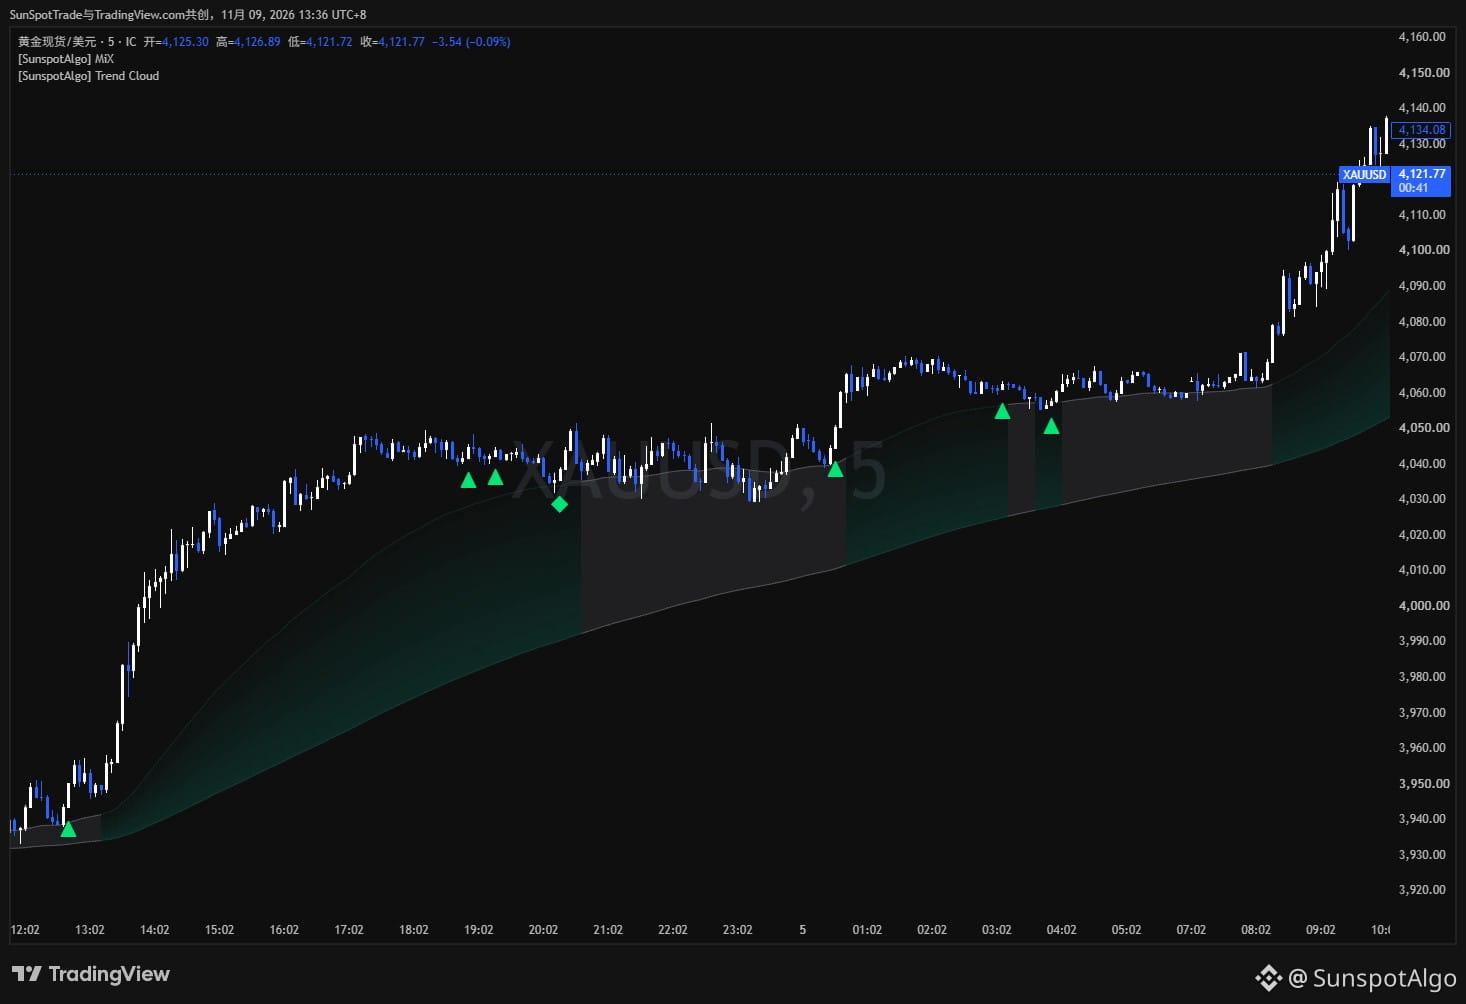
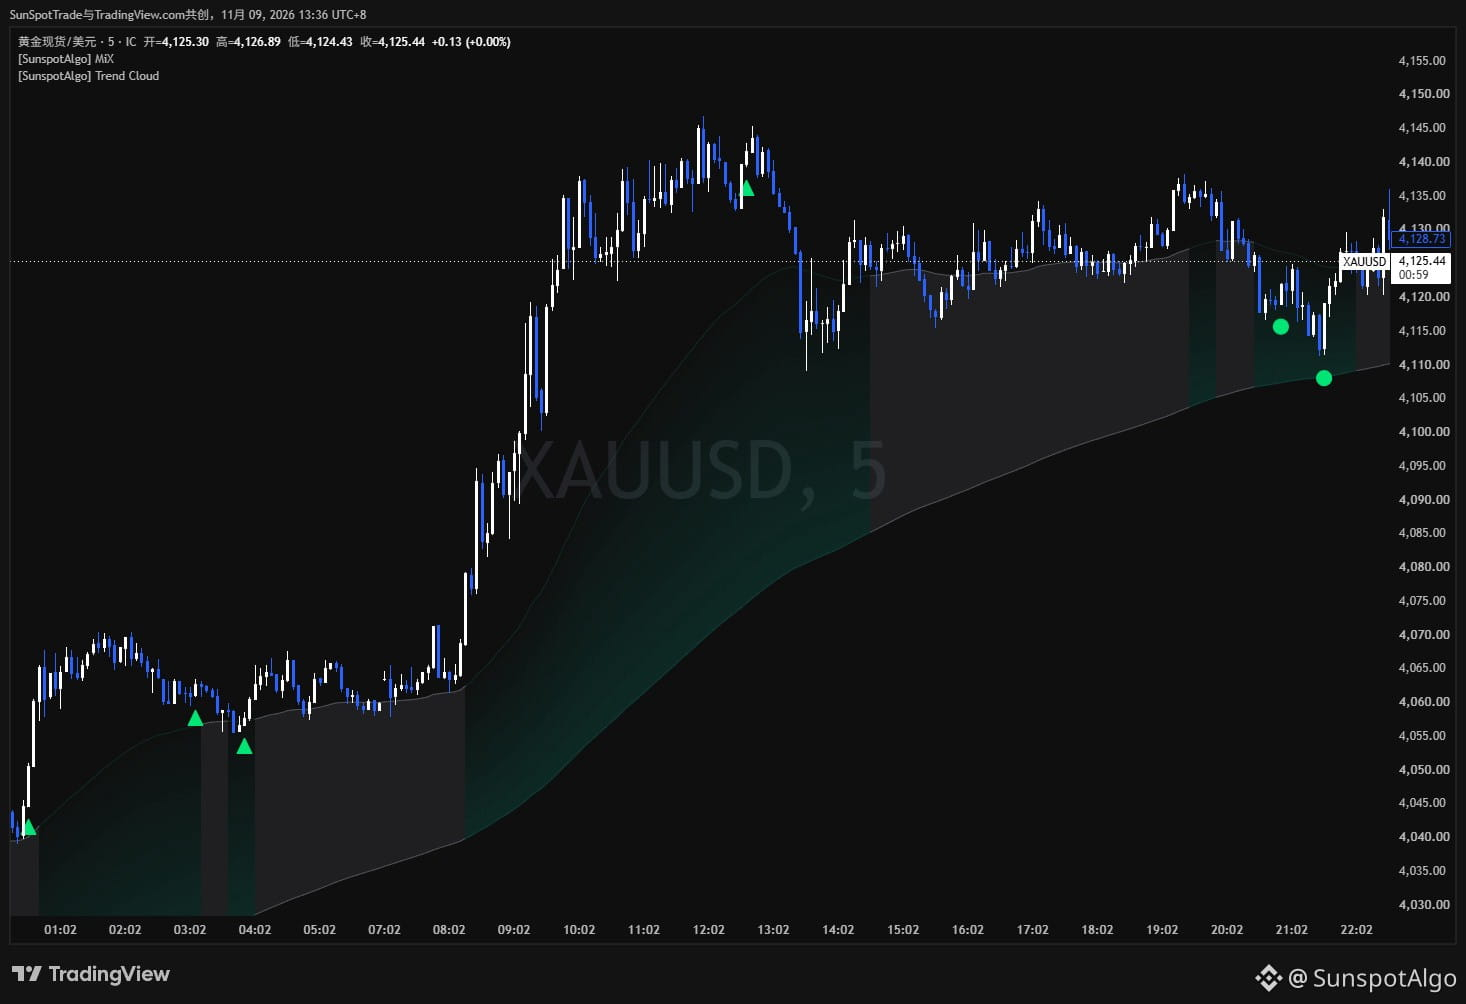
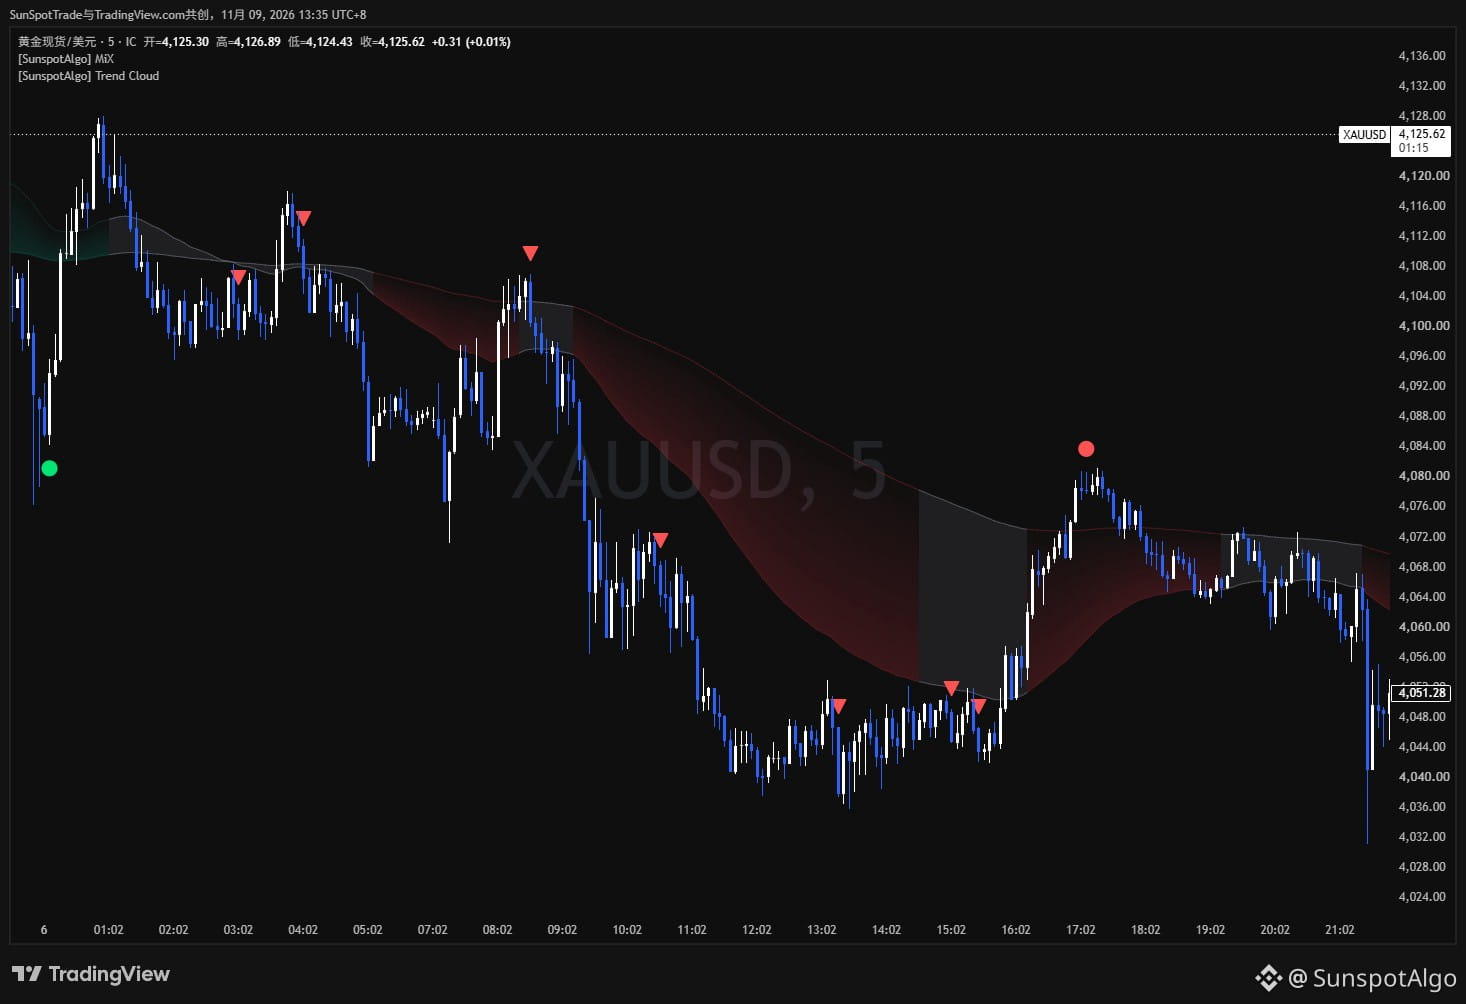
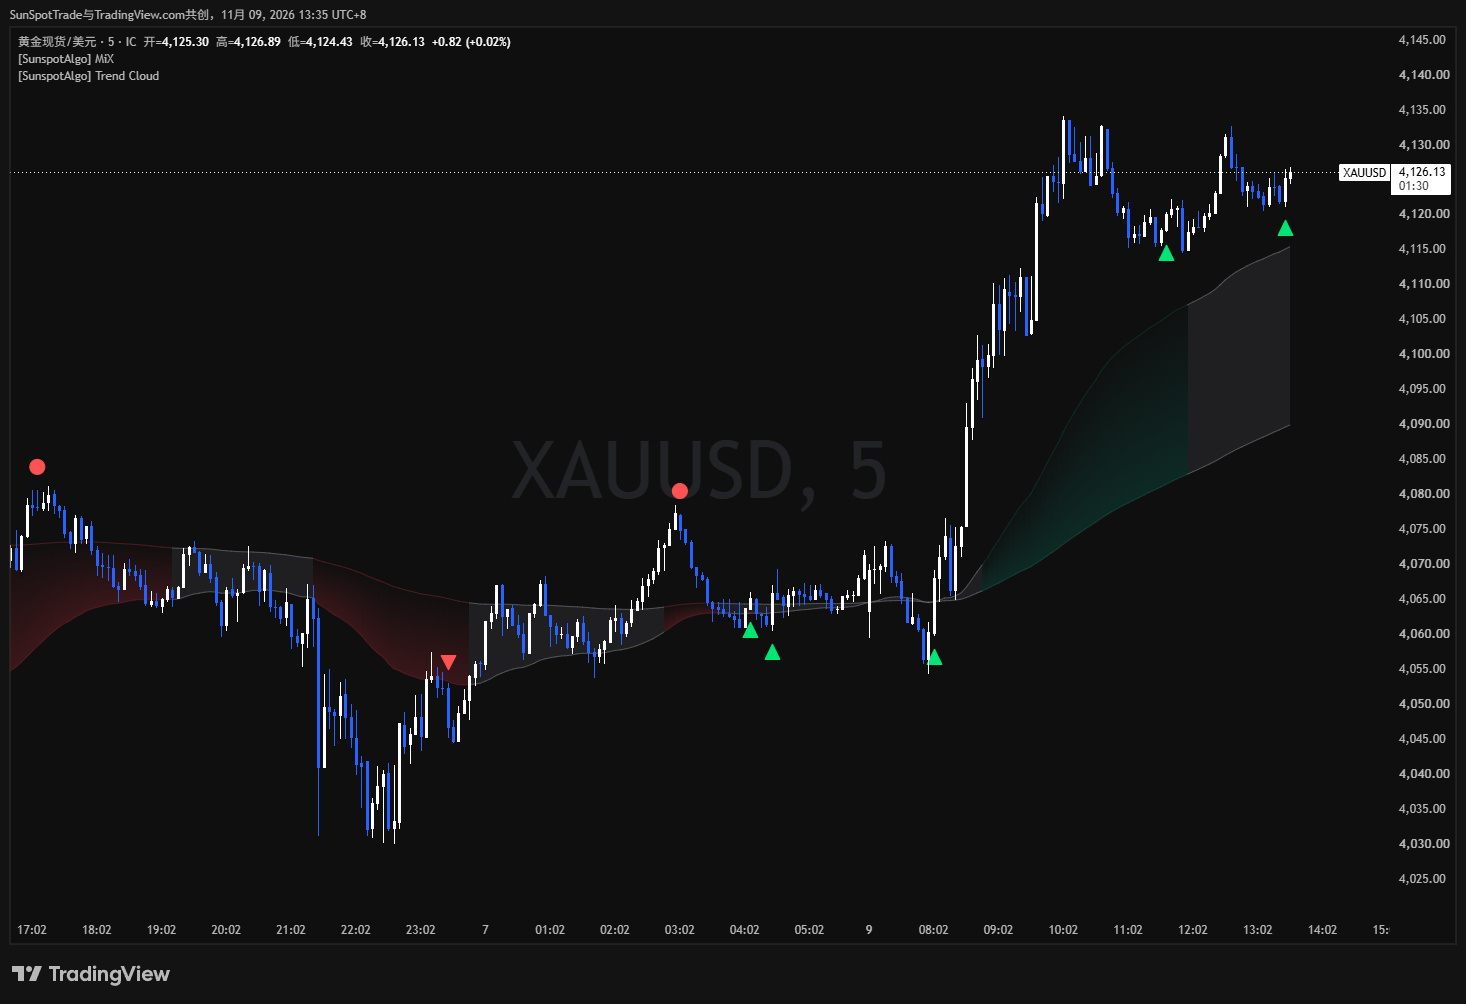
These are a few 5-minute gold charts, captured with these settings. Only markers aligned with the current direction are shown. The red and green triangles all point the same way, making the chart much cleaner than when all signals are enabled.
Trend, reversal, and confluence are three independent types of signals. If you want to follow the trend, enable only trend signals. If you want to buy bottoms or sell tops, turn on reversal signals. The two don’t interfere with each other. MIX doesn’t make decisions for you; it simply keeps different signal types separate.
MIX generates and locks signals when each candlestick closes. It doesn’t use future data or repaint. It isn’t tuned for any particular instrument or timeframe, so you can use it with any candlestick chart. At a pace like the 5-minute timeframe, signals will be more frequent, and you’ll see consecutive markers pointing in the same direction within a trend. That’s why filtering becomes important.
You can take screenshots and track the win rate and risk-reward ratio yourself, placing the charts back in the context of the full trend and reviewing each candlestick using consistent criteria.
——————————————
Thanks for following, and feel free to share your observations and ideas in the comments. I’ll continue sharing chart records and market observations for everyone’s reference.
These are a few 5-minute gold charts, captured with these settings. Only markers aligned with the current direction are shown. The red and green triangles all point the same way, making the chart much cleaner than when all signals are enabled.
Trend, reversal, and confluence are three independent types of signals. If you want to follow the trend, enable only trend signals. If you want to buy bottoms or sell tops, turn on reversal signals. The two don’t interfere with each other. MIX doesn’t make decisions for you; it simply keeps different signal types separate.
MIX generates and locks signals when each candlestick closes. It doesn’t use future data or repaint. It isn’t tuned for any particular instrument or timeframe, so you can use it with any candlestick chart. At a pace like the 5-minute timeframe, signals will be more frequent, and you’ll see consecutive markers pointing in the same direction within a trend. That’s why filtering becomes important.
You can take screenshots and track the win rate and risk-reward ratio yourself, placing the charts back in the context of the full trend and reviewing each candlestick using consistent criteria.
——————————————
Thanks for following, and feel free to share your observations and ideas in the comments. I’ll continue sharing chart records and market observations for everyone’s reference.