I built MIX on TradingView, a predictive signal indicator.
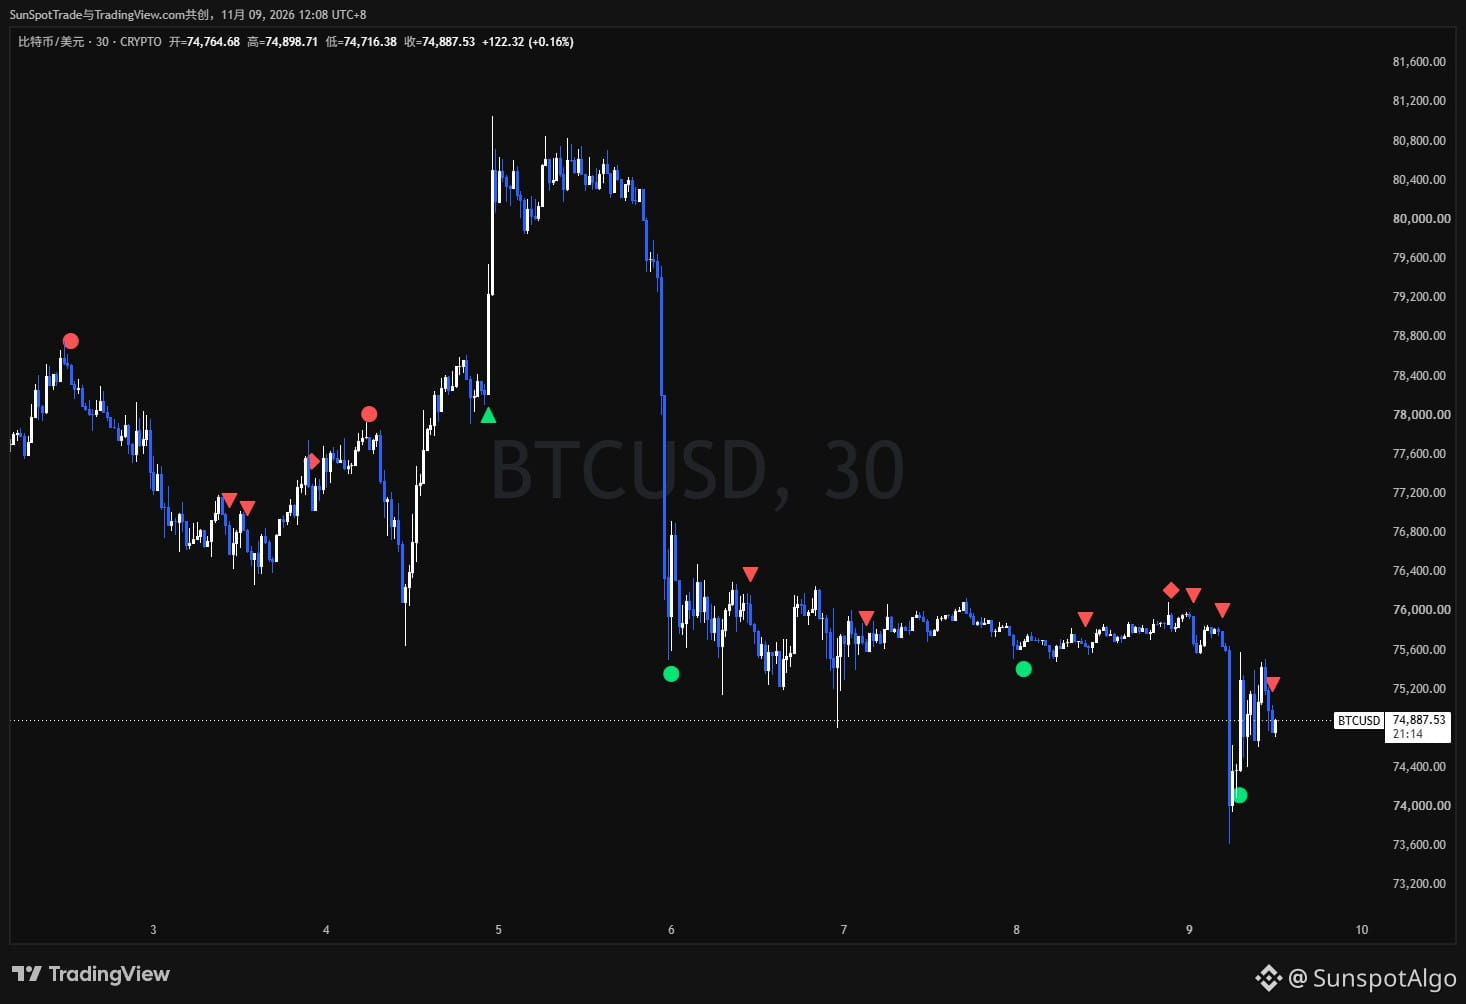
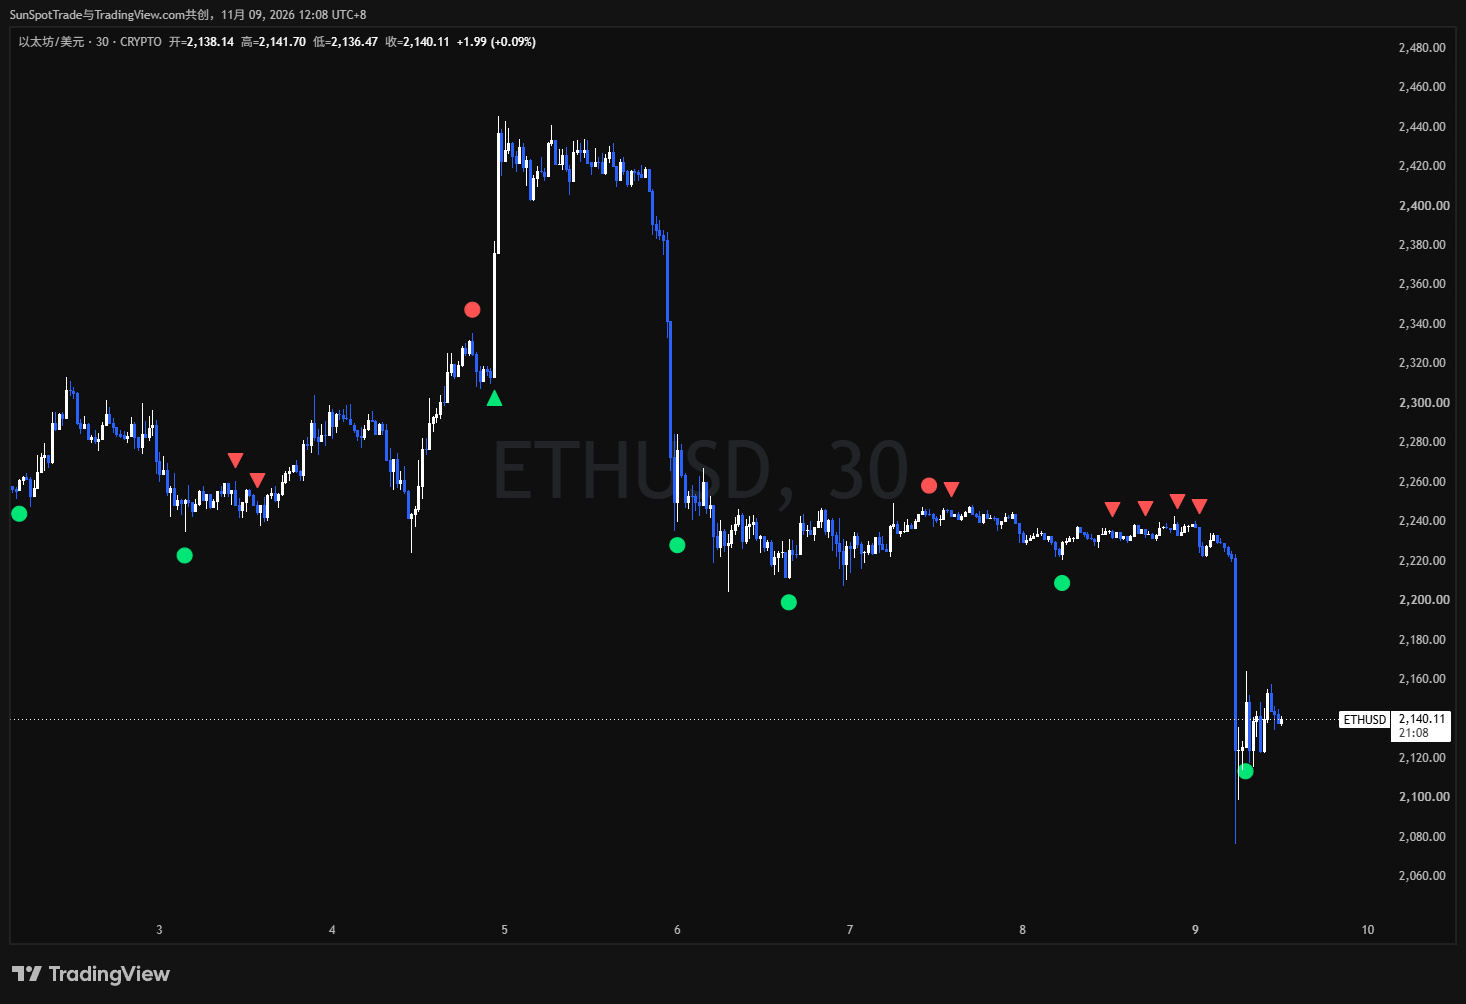
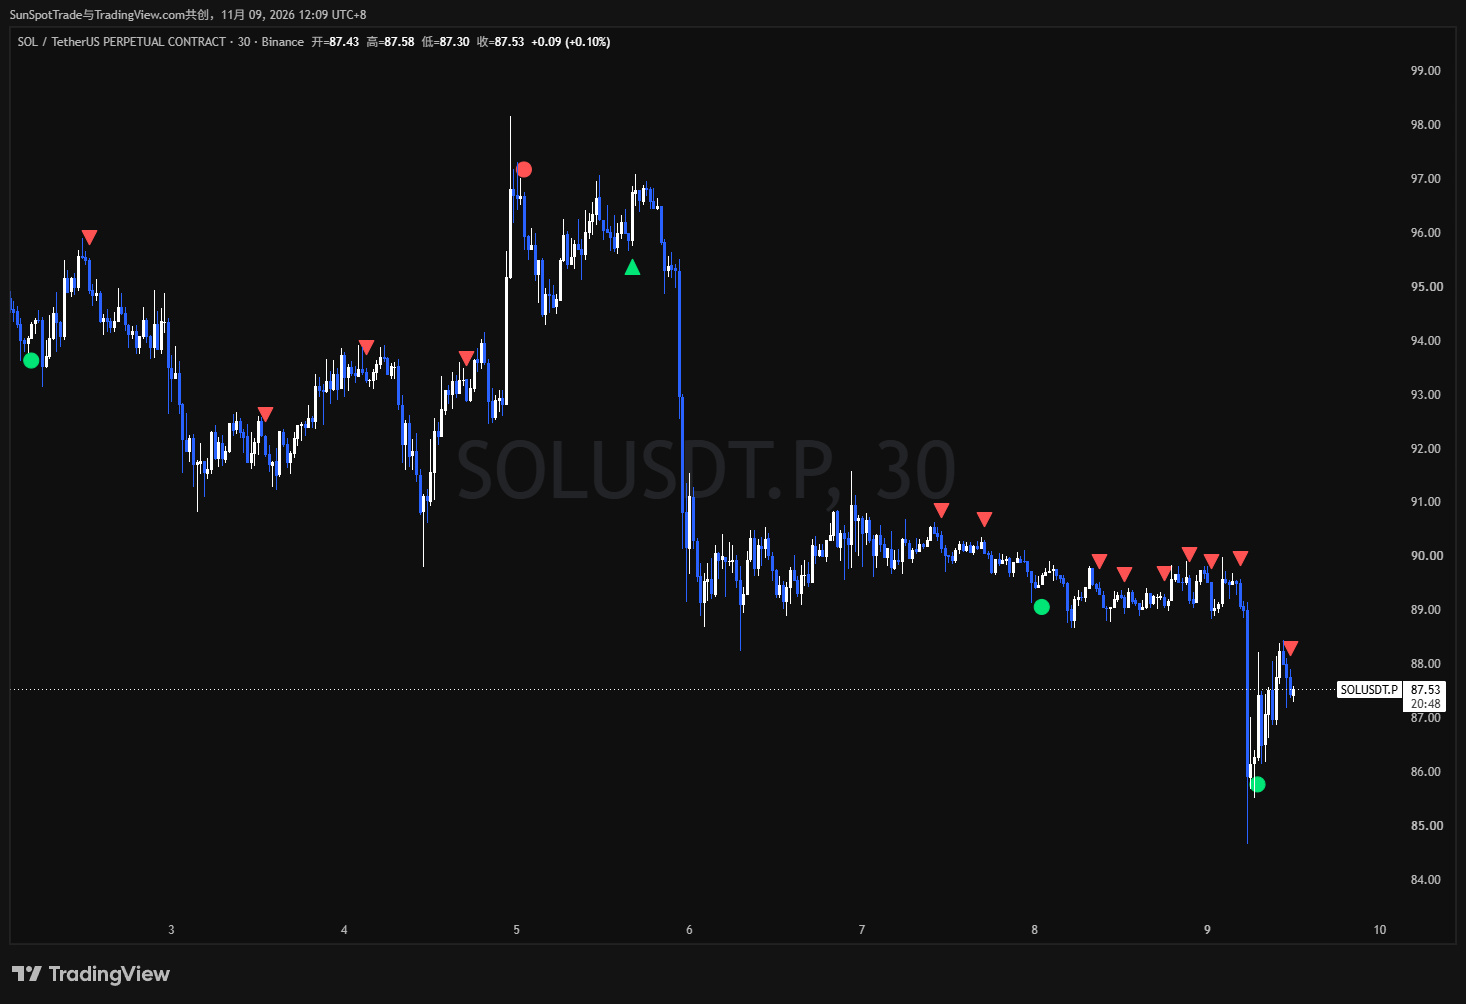
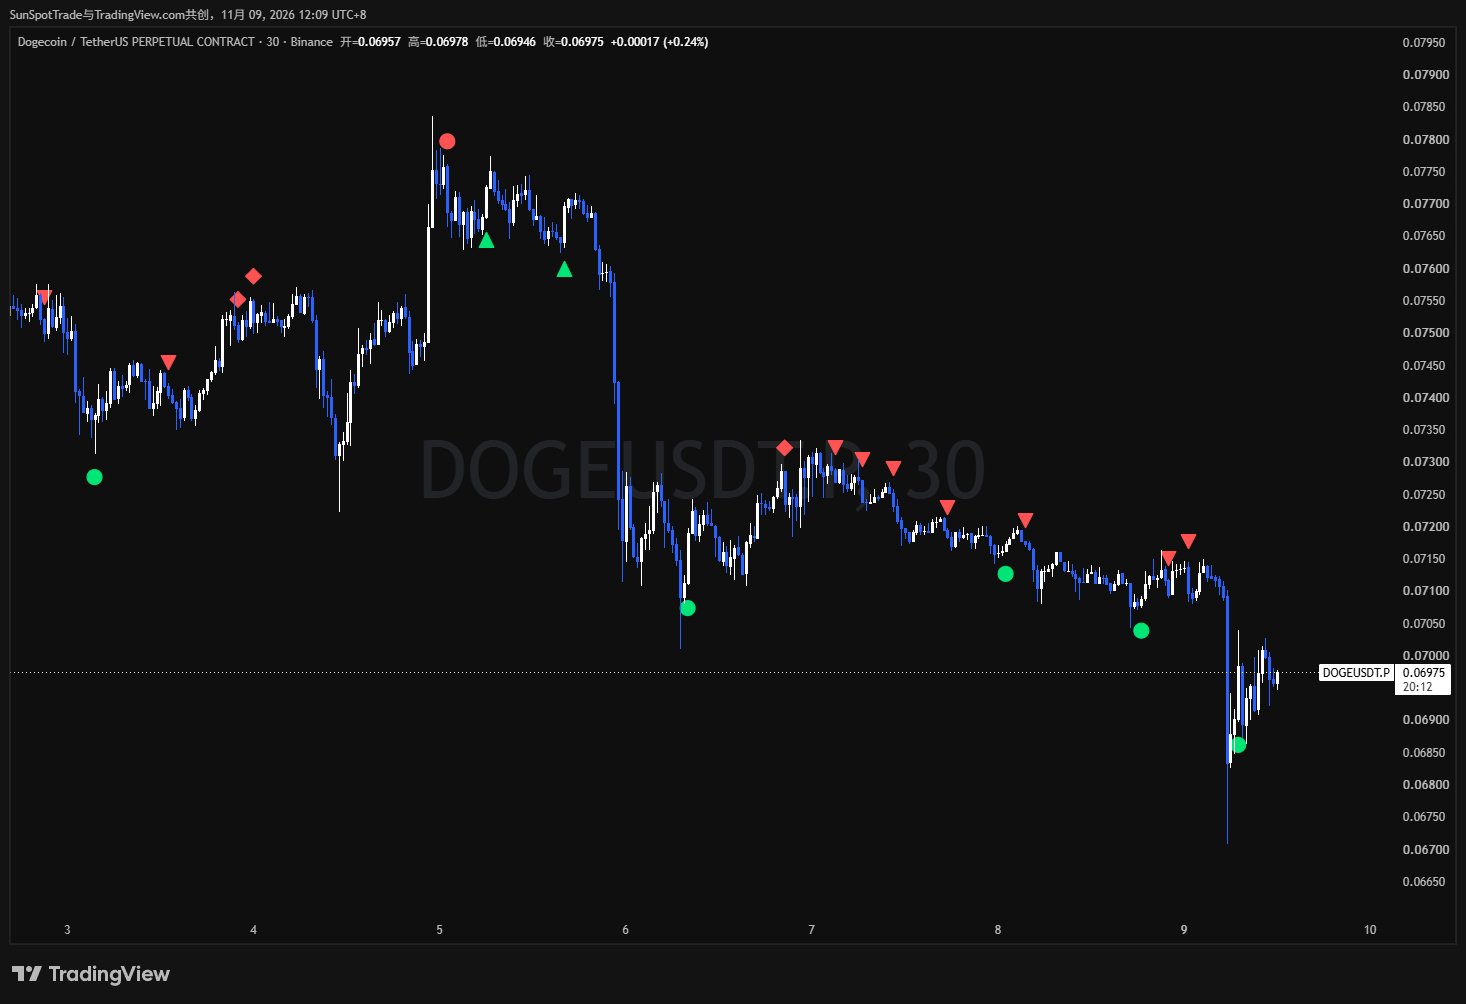
Red indicates short signals, and green indicates long signals. Circles mark reversals, while triangles mark trend-following signals. All four charts are on the 30-minute timeframe—BTC, ETH, SOL, and DOGE—and show how the signals changed over the same stretch of market activity.
MIX generates and locks in signals when a candlestick closes. It uses no future data and does not repaint. This is a fundamental design principle, not an after-the-fact claim.
It has not been specially tuned for any particular asset or timeframe. If an asset has a candlestick chart on TradingView, MIX can be used on it. The same set of rules applies across crypto and indices, from 15-minute to 4-hour charts. Changing the timeframe only changes the signal frequency.
Achieving both a high win rate and a high risk-reward ratio without repainting is no easy feat, and no one can accurately predict how the next candlestick will move. You can take screenshots and track the win rate and risk-reward ratio yourself, then review each candle against the same consistent criteria with the full price action in view.
——————————————
Thanks for following along. Feel free to share your observations and ideas in the comments. I’ll continue sharing chart records and market observations for reference.
Red indicates short signals, and green indicates long signals. Circles mark reversals, while triangles mark trend-following signals. All four charts are on the 30-minute timeframe—BTC, ETH, SOL, and DOGE—and show how the signals changed over the same stretch of market activity.
MIX generates and locks in signals when a candlestick closes. It uses no future data and does not repaint. This is a fundamental design principle, not an after-the-fact claim.
It has not been specially tuned for any particular asset or timeframe. If an asset has a candlestick chart on TradingView, MIX can be used on it. The same set of rules applies across crypto and indices, from 15-minute to 4-hour charts. Changing the timeframe only changes the signal frequency.
Achieving both a high win rate and a high risk-reward ratio without repainting is no easy feat, and no one can accurately predict how the next candlestick will move. You can take screenshots and track the win rate and risk-reward ratio yourself, then review each candle against the same consistent criteria with the full price action in view.
——————————————
Thanks for following along. Feel free to share your observations and ideas in the comments. I’ll continue sharing chart records and market observations for reference.