🚨 BTC at a Make-or-Break Pivot 🚨
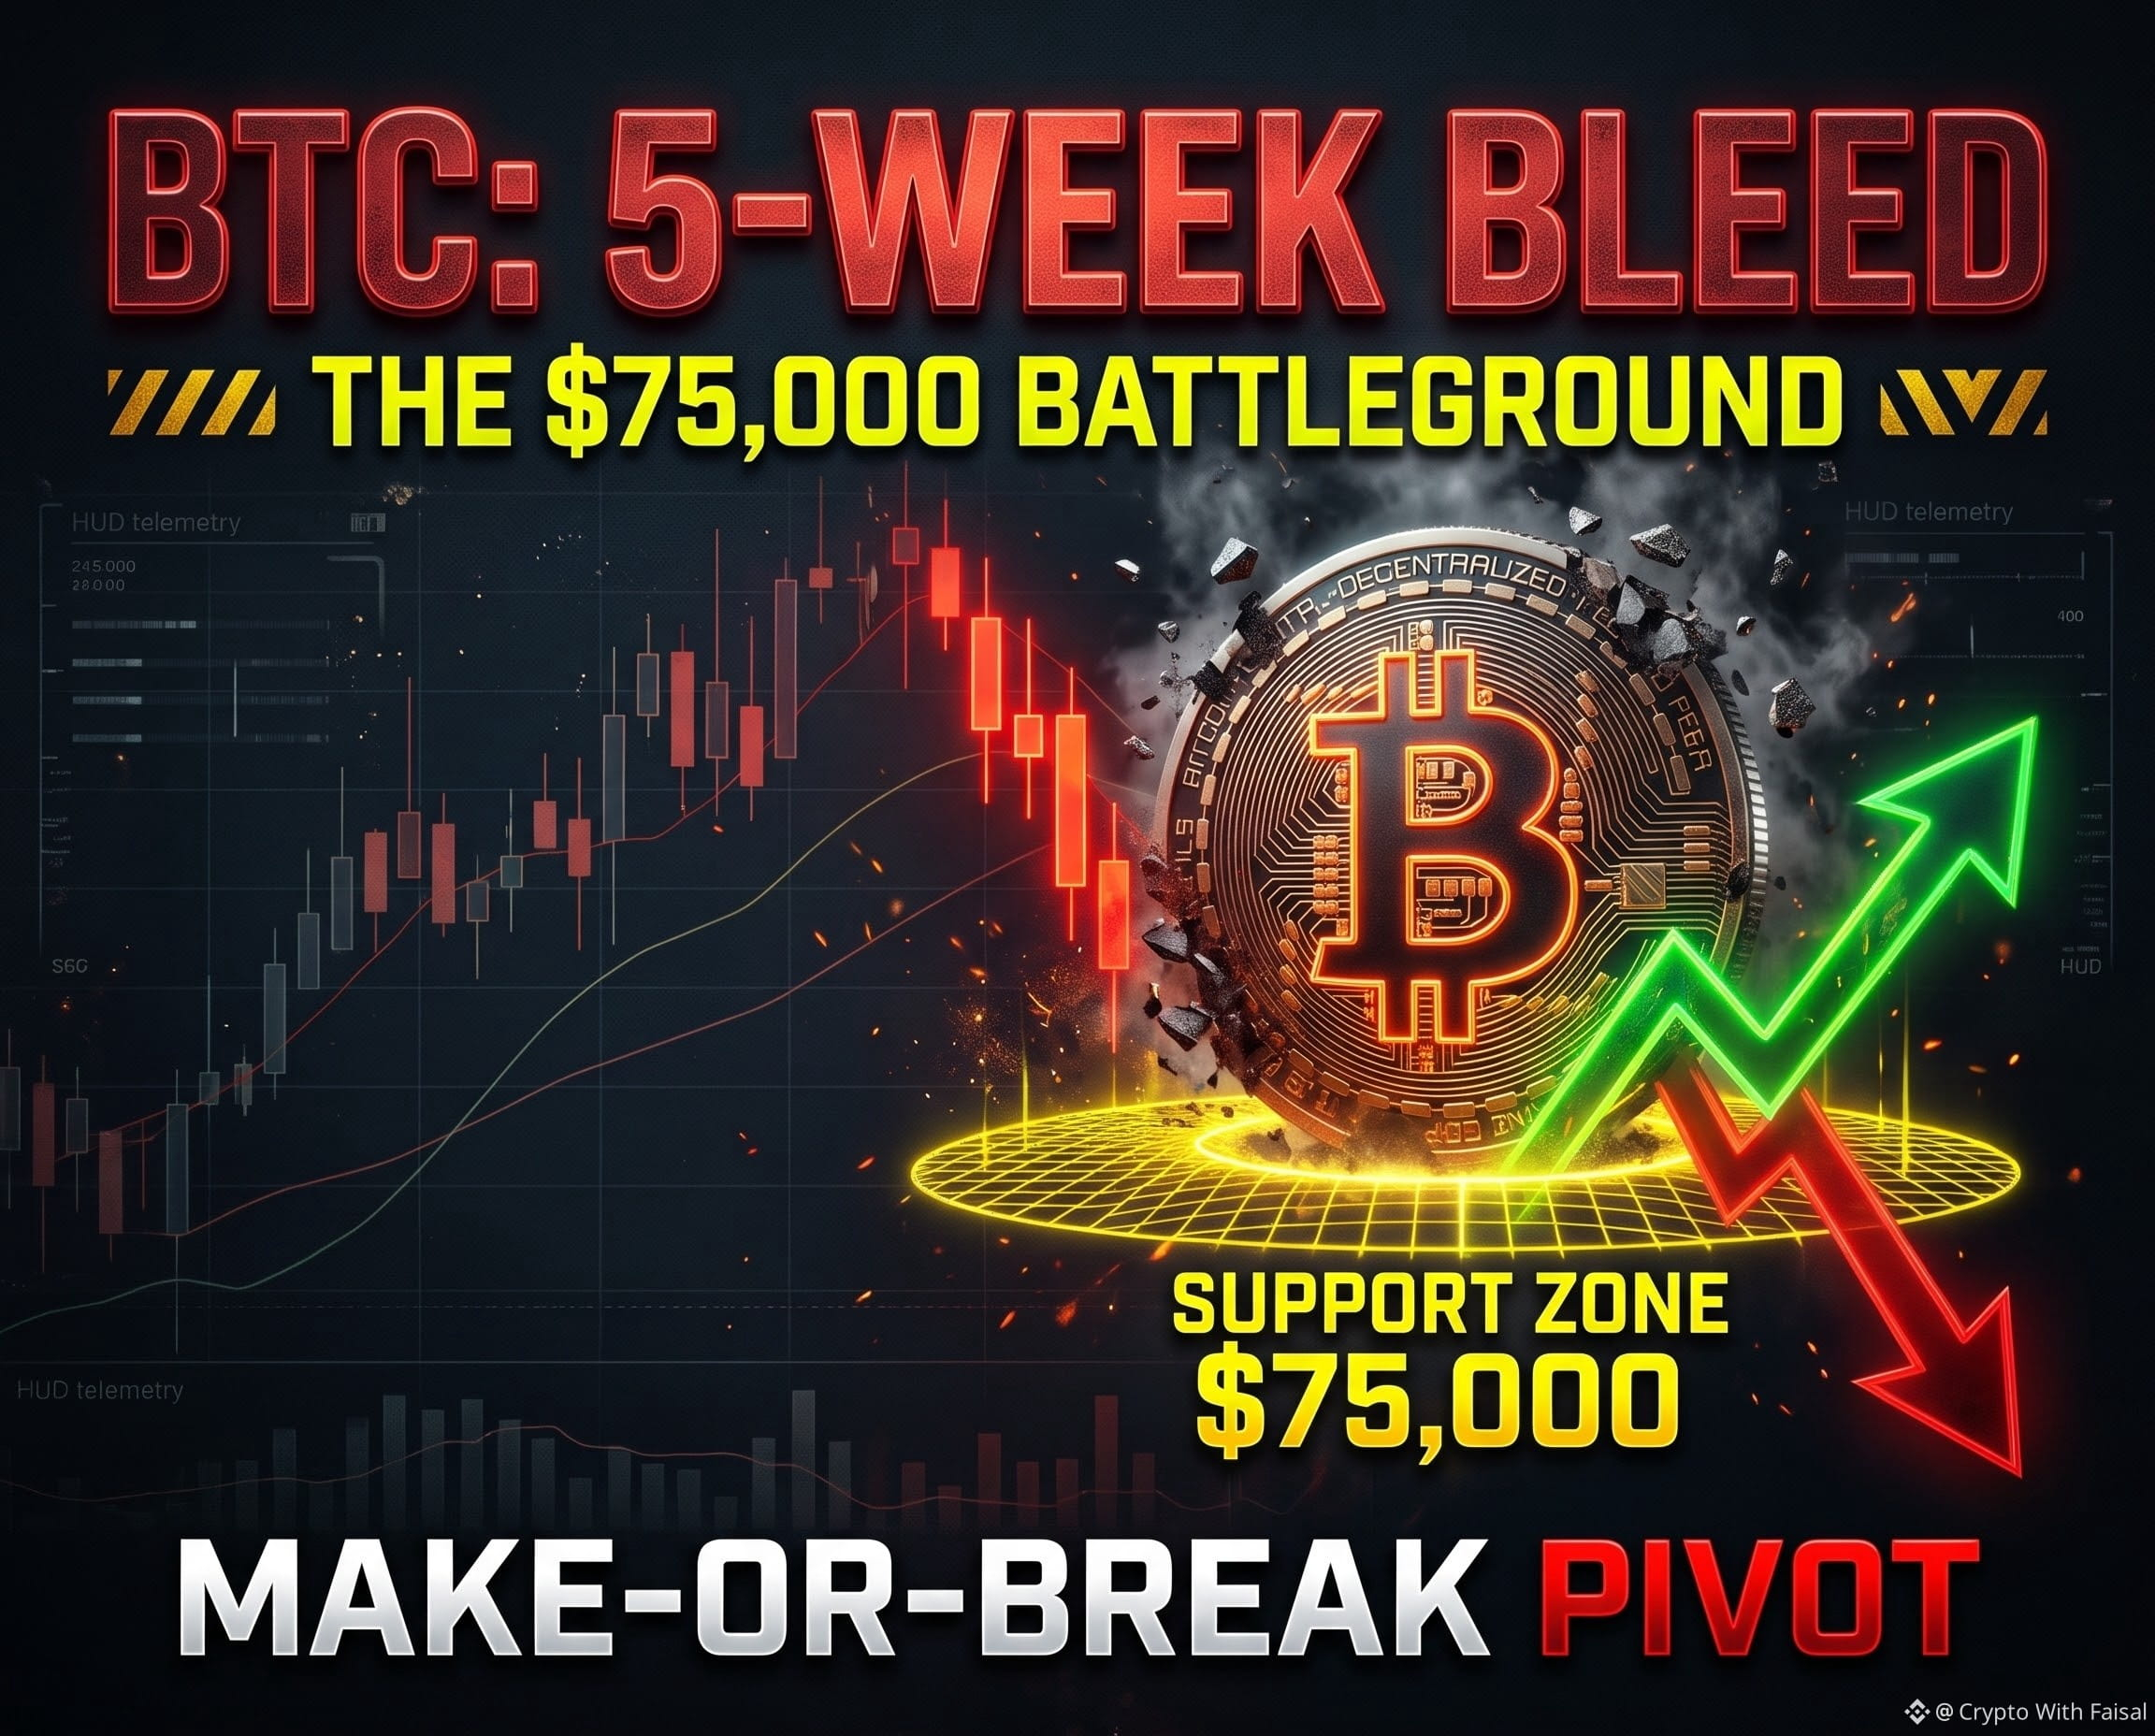
Bitcoin just printed its 5th consecutive weekly red candle, fighting to hold the line at $75,000. If you’ve been in the market long enough, you know this kind of sustained selling pressure is rare—and it usually signals maximum fear.
Take a close look at the technical breakdown.
We are currently testing a critical confluence of support. The $75,000 to $76,000 zone acts as the average cost basis for short-term holders. It is the ultimate line in the sand right now.
📊 The Trader’s Playbook:
🔹 The Bulls: If this $75K support holds strong, we could see an aggressive bounce as late shorters get squeezed. Reclaiming the $82,000 resistance is the first major step to opening a path back toward $87,000.
🔹 The Bears: If we lose this base on high volume, the market could quickly slide. Breaking below the $73,000 to $74,000 zone would leave BTC exposed to a much deeper retracement.
Professional trading isn't about perfectly guessing the bottom; it's about reacting to key levels with strict risk management. Five weeks of bleeding shakes out weak hands, but it’s exactly where smart money starts building strategic, calculated positions.
What’s your move here? Are you buying the fear or waiting for a deeper dip? Let me know below! 👇
$BTC $ETH $SOL
#bitcoinfiveweeklylosses
#BTC #CryptoTrading #BinanceSquare
Bitcoin just printed its 5th consecutive weekly red candle, fighting to hold the line at $75,000. If you’ve been in the market long enough, you know this kind of sustained selling pressure is rare—and it usually signals maximum fear.
Take a close look at the technical breakdown.
We are currently testing a critical confluence of support. The $75,000 to $76,000 zone acts as the average cost basis for short-term holders. It is the ultimate line in the sand right now.
📊 The Trader’s Playbook:
🔹 The Bulls: If this $75K support holds strong, we could see an aggressive bounce as late shorters get squeezed. Reclaiming the $82,000 resistance is the first major step to opening a path back toward $87,000.
🔹 The Bears: If we lose this base on high volume, the market could quickly slide. Breaking below the $73,000 to $74,000 zone would leave BTC exposed to a much deeper retracement.
Professional trading isn't about perfectly guessing the bottom; it's about reacting to key levels with strict risk management. Five weeks of bleeding shakes out weak hands, but it’s exactly where smart money starts building strategic, calculated positions.
What’s your move here? Are you buying the fear or waiting for a deeper dip? Let me know below! 👇
$BTC $ETH $SOL
#bitcoinfiveweeklylosses
#BTC #CryptoTrading #BinanceSquare