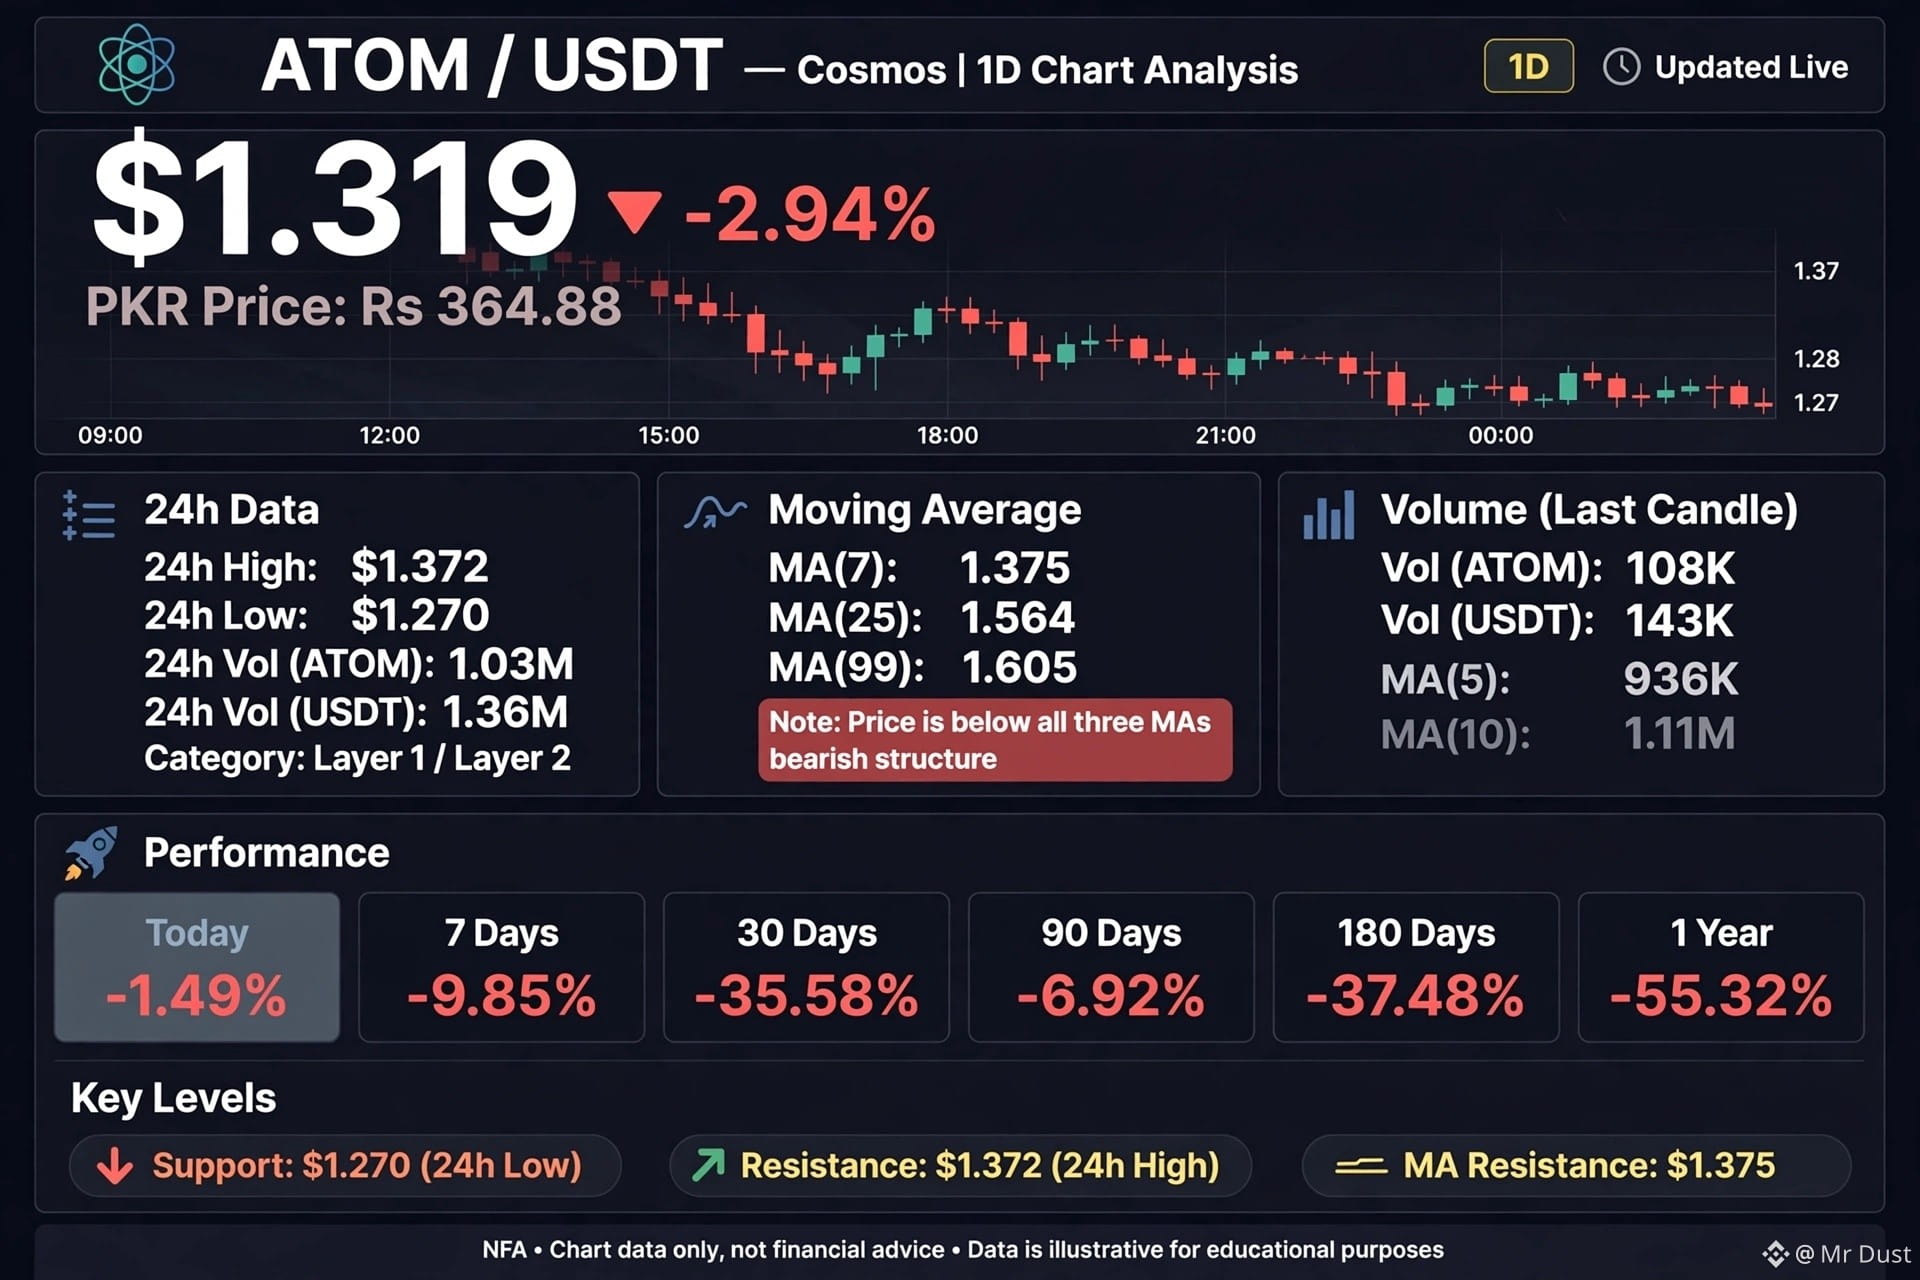
$ATOM / USDT - Cosmos | 1D Chart Analysis 📊
Date: 09 Nov 2026
💰 Live Price: $1.319
PKR Price: Rs 364.88
24h Change: -2.94%
📈 24h Data:
24h High: $1.372
24h Low: $1.270
24h Vol (ATOM): 1.03M
24h Vol (USDT): 1.36M
Category: Layer 1 / Layer 2
📉 Moving Average (MA):
MA(7): 1.375
MA(25): 1.564
MA(99): 1.605
The price is currently below all three MAs, which clearly shows a bearish structure on the chart.
📊 Volume - Last Candle:
Vol (ATOM): 108K
Vol (USDT): 143K
MA(5): 936K
MA(10): 1.11M
📅 Performance - According to the Chart:
Today: -1.49%
7 Days: -9.85%
30 Days: -35.58%
90 Days: -6.92%
180 Days: -37.48%
1 Year: -55.32%
🔑 Levels Identified on the Chart:
Support Zone: $1.270 - This is the 24h low, and a wick touched it on the chart
Resistance Zone: $1.372 - This is the 24h high
MA Resistance: $1.375 - The MA(7) line
📌 Summary:
The chart is on the 1D timeframe, and the price fell continuously from 02 Nov 2026 to 06 Nov 2026. The last candle closed at $1.319, slightly above the low of $1.270.
What do you think? Will ATOM hold $1.270 or break below it? Let us know in the comments 👇
#ATOMUSDT #Cosmos #Crypto #MrDust #tradingview
⚠️ NFA - This is only an analysis of the data shown on the chart, not financial advice. Please do your own research.
Date: 09 Nov 2026
💰 Live Price: $1.319
PKR Price: Rs 364.88
24h Change: -2.94%
📈 24h Data:
24h High: $1.372
24h Low: $1.270
24h Vol (ATOM): 1.03M
24h Vol (USDT): 1.36M
Category: Layer 1 / Layer 2
📉 Moving Average (MA):
MA(7): 1.375
MA(25): 1.564
MA(99): 1.605
The price is currently below all three MAs, which clearly shows a bearish structure on the chart.
📊 Volume - Last Candle:
Vol (ATOM): 108K
Vol (USDT): 143K
MA(5): 936K
MA(10): 1.11M
📅 Performance - According to the Chart:
Today: -1.49%
7 Days: -9.85%
30 Days: -35.58%
90 Days: -6.92%
180 Days: -37.48%
1 Year: -55.32%
🔑 Levels Identified on the Chart:
Support Zone: $1.270 - This is the 24h low, and a wick touched it on the chart
Resistance Zone: $1.372 - This is the 24h high
MA Resistance: $1.375 - The MA(7) line
📌 Summary:
The chart is on the 1D timeframe, and the price fell continuously from 02 Nov 2026 to 06 Nov 2026. The last candle closed at $1.319, slightly above the low of $1.270.
What do you think? Will ATOM hold $1.270 or break below it? Let us know in the comments 👇
#ATOMUSDT #Cosmos #Crypto #MrDust #tradingview
⚠️ NFA - This is only an analysis of the data shown on the chart, not financial advice. Please do your own research.