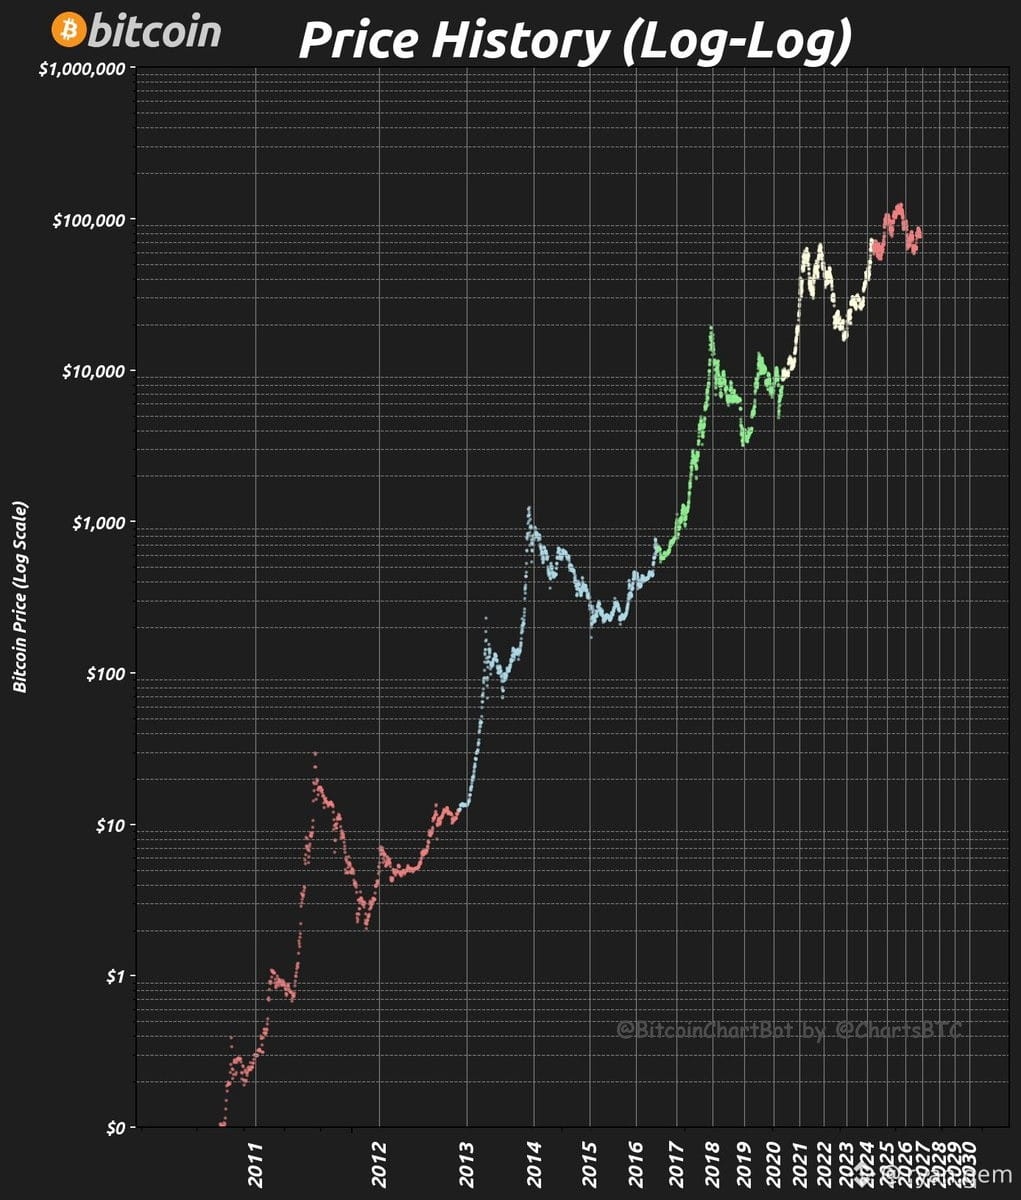
The log-log chart speaks volumes.
$BTC price history on a logarithmic scale shows the bigger picture—exponential growth patterns, diminishing volatility over cycles, and where we are in the macro trend.
Zoom out. The structure is still intact. Each cycle prints higher lows, tighter ranges, and more institutional conviction.
If you're not tracking this view, you're trading noise instead of signal.
$BTC price history on a logarithmic scale shows the bigger picture—exponential growth patterns, diminishing volatility over cycles, and where we are in the macro trend.
Zoom out. The structure is still intact. Each cycle prints higher lows, tighter ranges, and more institutional conviction.
If you're not tracking this view, you're trading noise instead of signal.