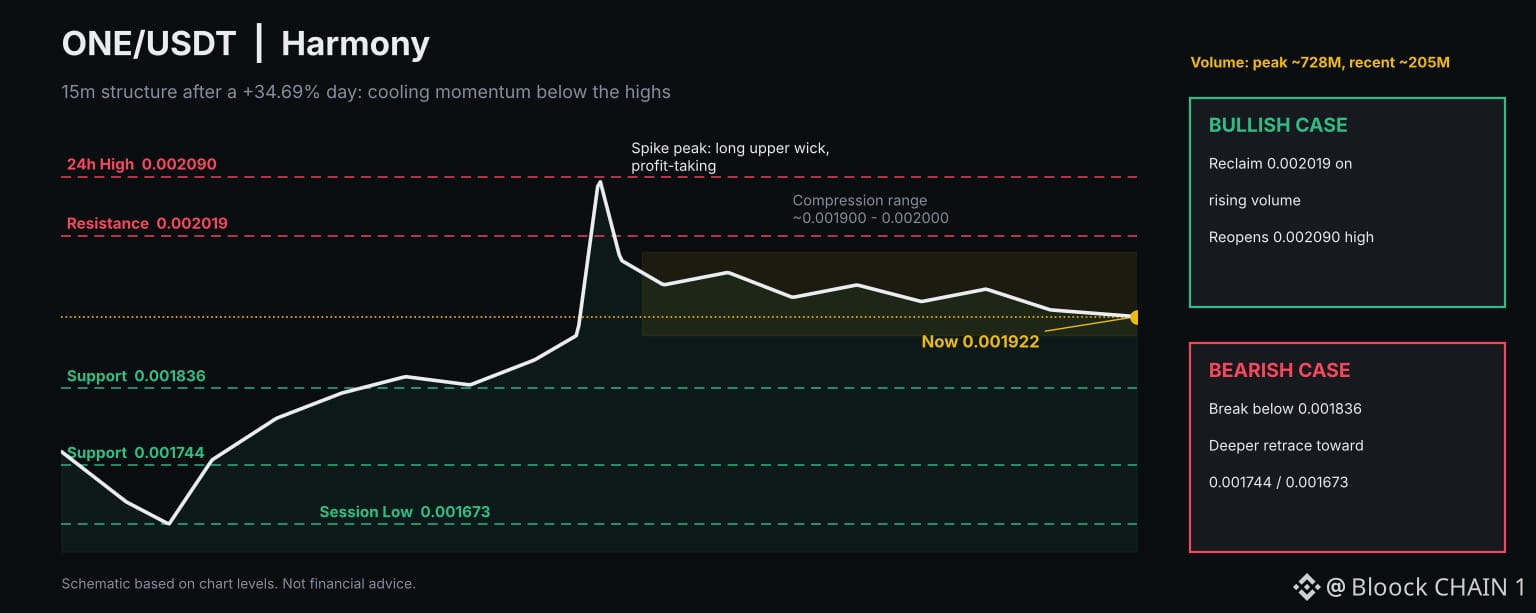
Harmony's $ONE /USDT is trading at 0.001922, up 34.69% on the day, yet the 15-minute chart shows momentum fading near the highs. A sharp vertical push carried price to the 24h high of 0.002090, but the long upper wick on that candle signals aggressive profit-taking. Sellers have defended that zone ever since.
Since then, price has compressed into a tight band between roughly 0.001900 and 0.002000, printing a string of small-bodied candles. The latest red candles, with upper wicks near 0.002000, suggest buyers are struggling to reclaim momentum.
Volume tells a similar story. The spike candle drew the largest bar on the chart, near 728M, while recent bars are noticeably lighter, hovering around 205M. The 5-period volume average has slipped back toward the 10-period line, showing cooling participation.
Key levels: support sits near 0.001836, with deeper support at 0.001744 and the session low at 0.001673. Resistance is 0.002019, then the 0.002090 peak.
Bullish case: a clean reclaim of 0.002019 on rising volume reopens the high. Bearish case: a breakdown below 0.001836 could trigger a deeper retracement.
Takeaway: after a 34% day, patience and confirmation matter more than chasing candles.
Since then, price has compressed into a tight band between roughly 0.001900 and 0.002000, printing a string of small-bodied candles. The latest red candles, with upper wicks near 0.002000, suggest buyers are struggling to reclaim momentum.
Volume tells a similar story. The spike candle drew the largest bar on the chart, near 728M, while recent bars are noticeably lighter, hovering around 205M. The 5-period volume average has slipped back toward the 10-period line, showing cooling participation.
Key levels: support sits near 0.001836, with deeper support at 0.001744 and the session low at 0.001673. Resistance is 0.002019, then the 0.002090 peak.
Bullish case: a clean reclaim of 0.002019 on rising volume reopens the high. Bearish case: a breakdown below 0.001836 could trigger a deeper retracement.
Takeaway: after a 34% day, patience and confirmation matter more than chasing candles.