Oh my god, looking at this chart $GTC makes me want to crawl into a hole 😭. The market’s been bleeding buckets for days, guys—we thought it was fireworks, but turns out they were duds 💀.
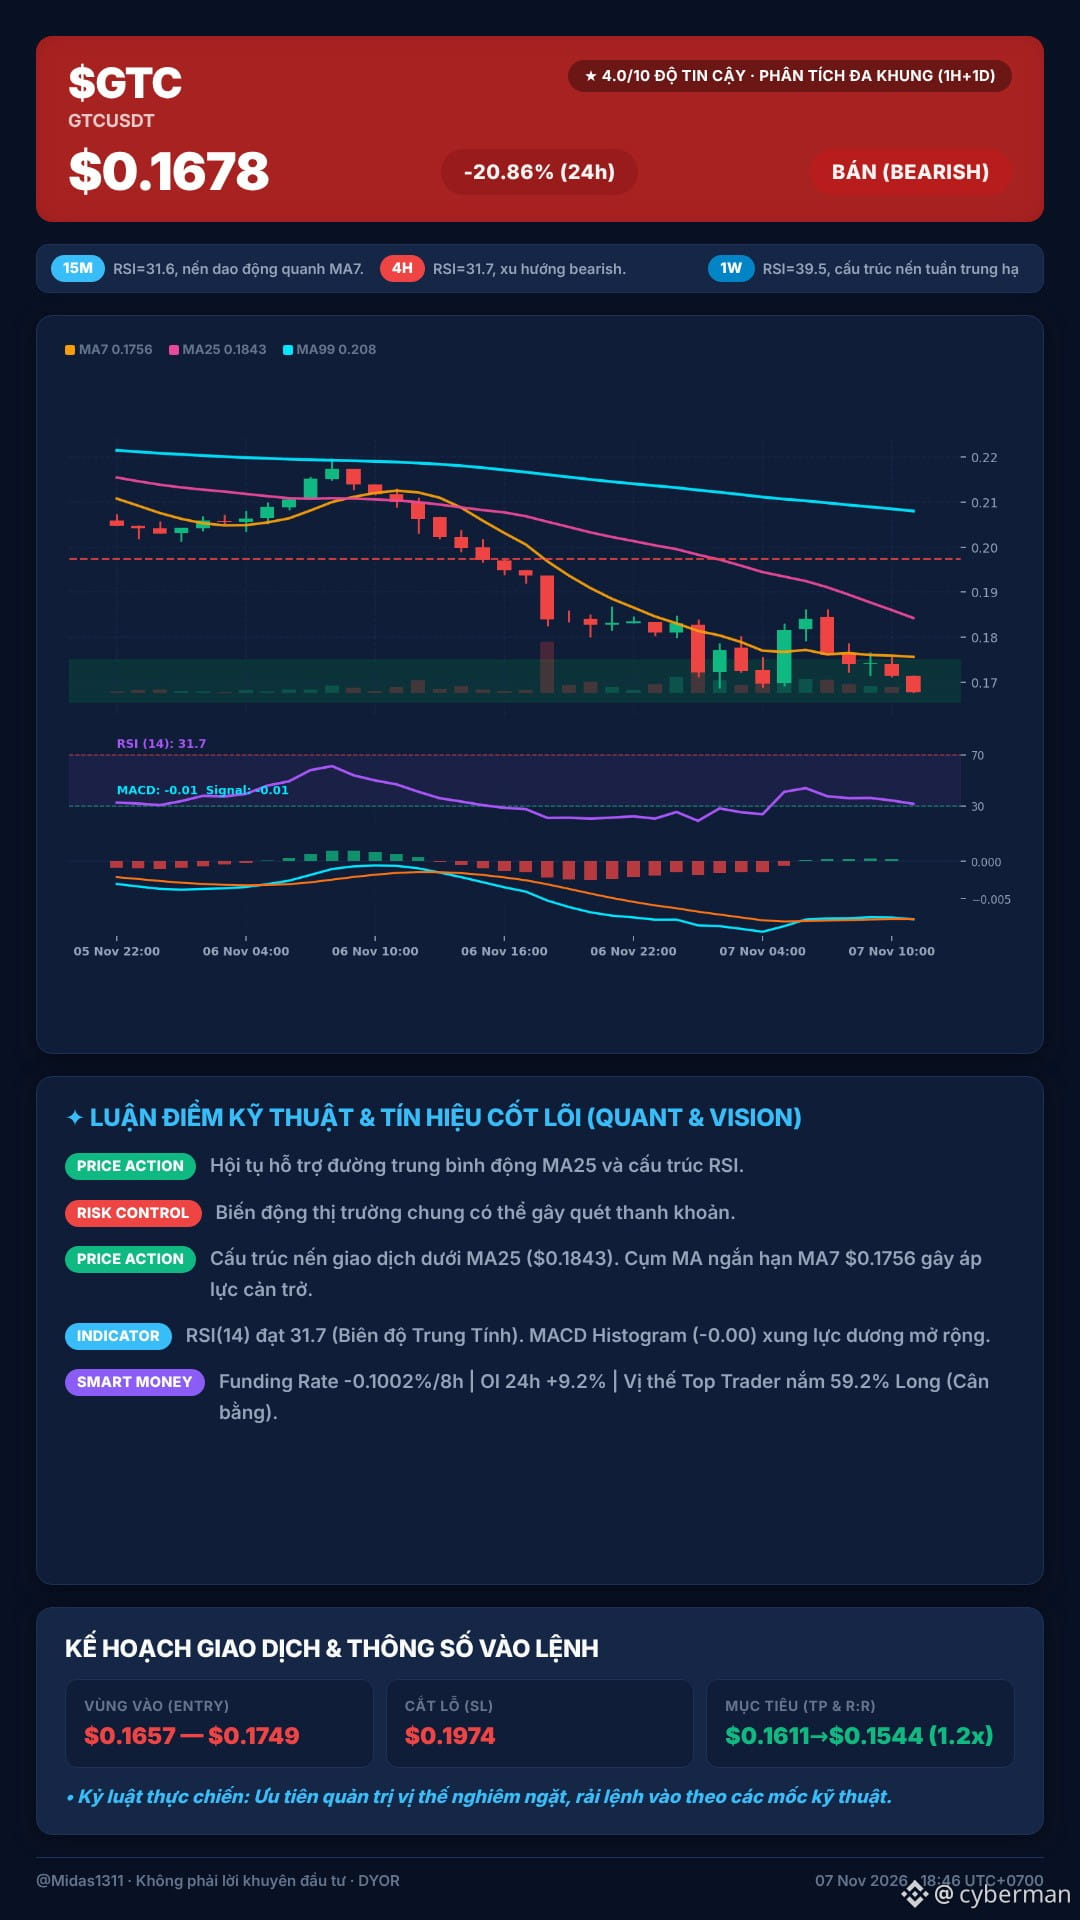
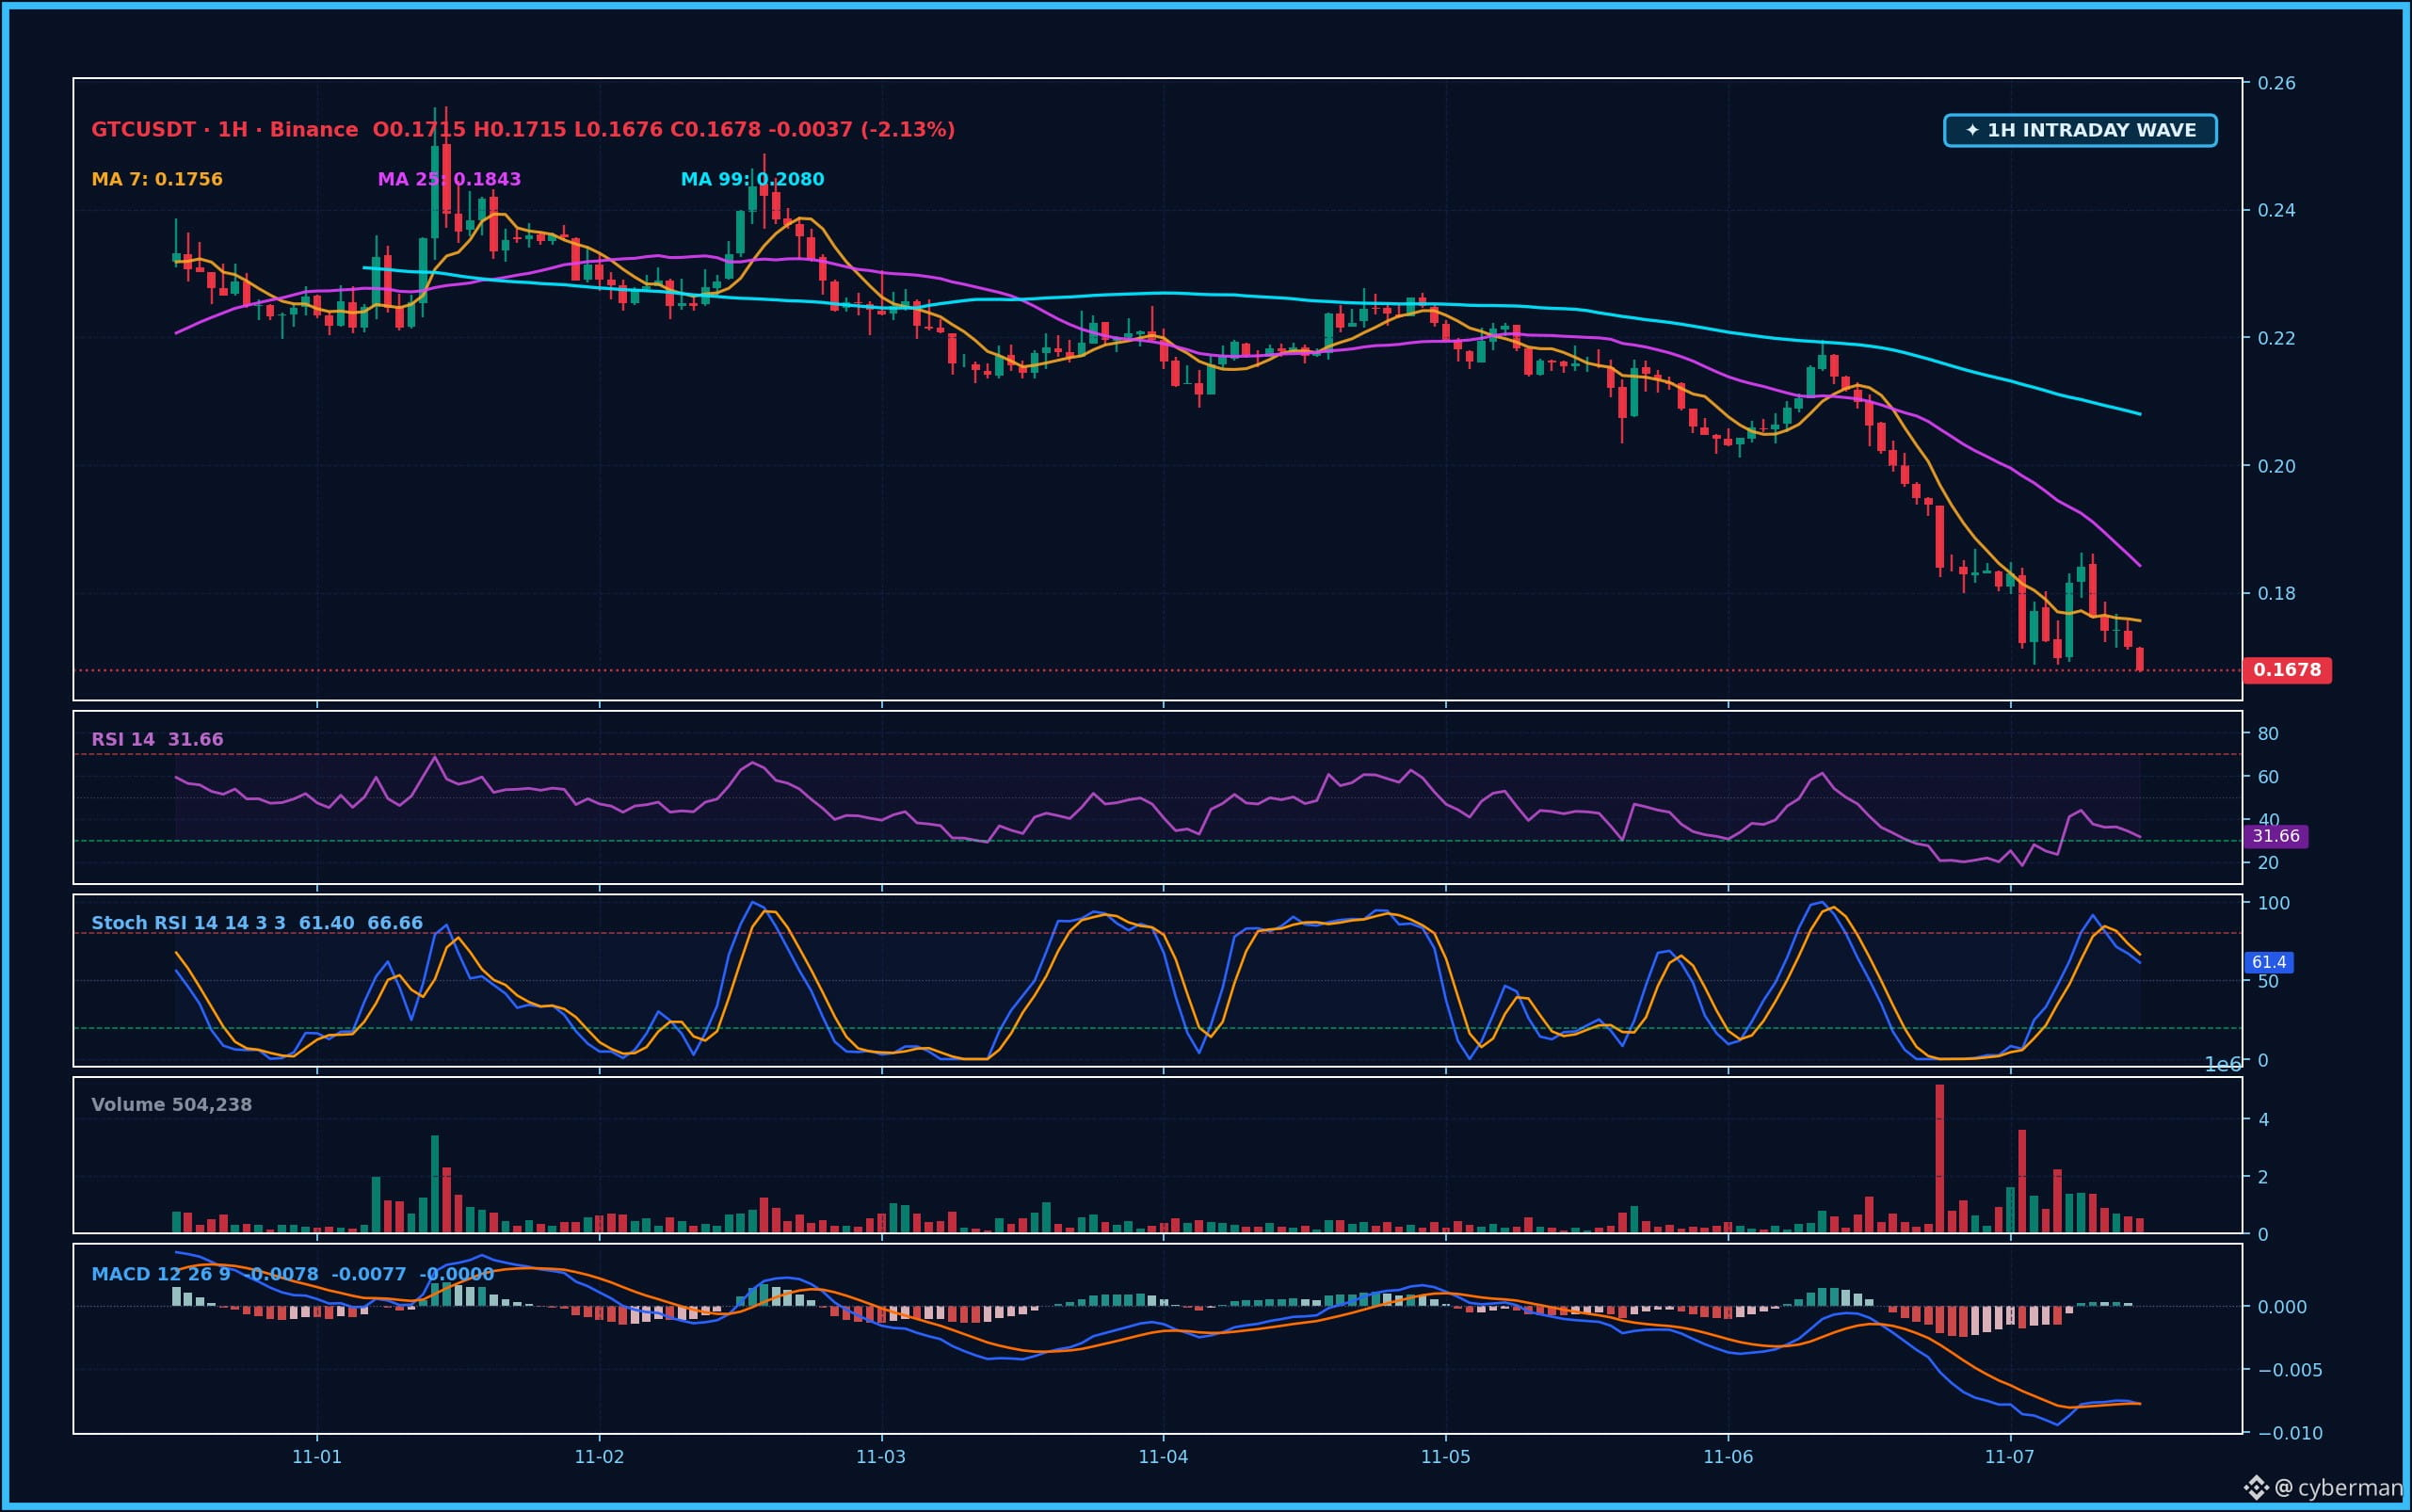
Looking at the 1H chart, $GTC is limping along around $0.1678, and the RSI at 31.7 is scraping the bottom, showing that selling pressure is still brutal. The short-term moving averages, like MA7 ($0.1756) and MA25 ($0.1843), are like nooses dangling overhead, putting a damper on any potential upward momentum. The 24-hour volume of $5,312,318 USDT isn’t huge, but it’s enough to drag the price down by 20.86%.
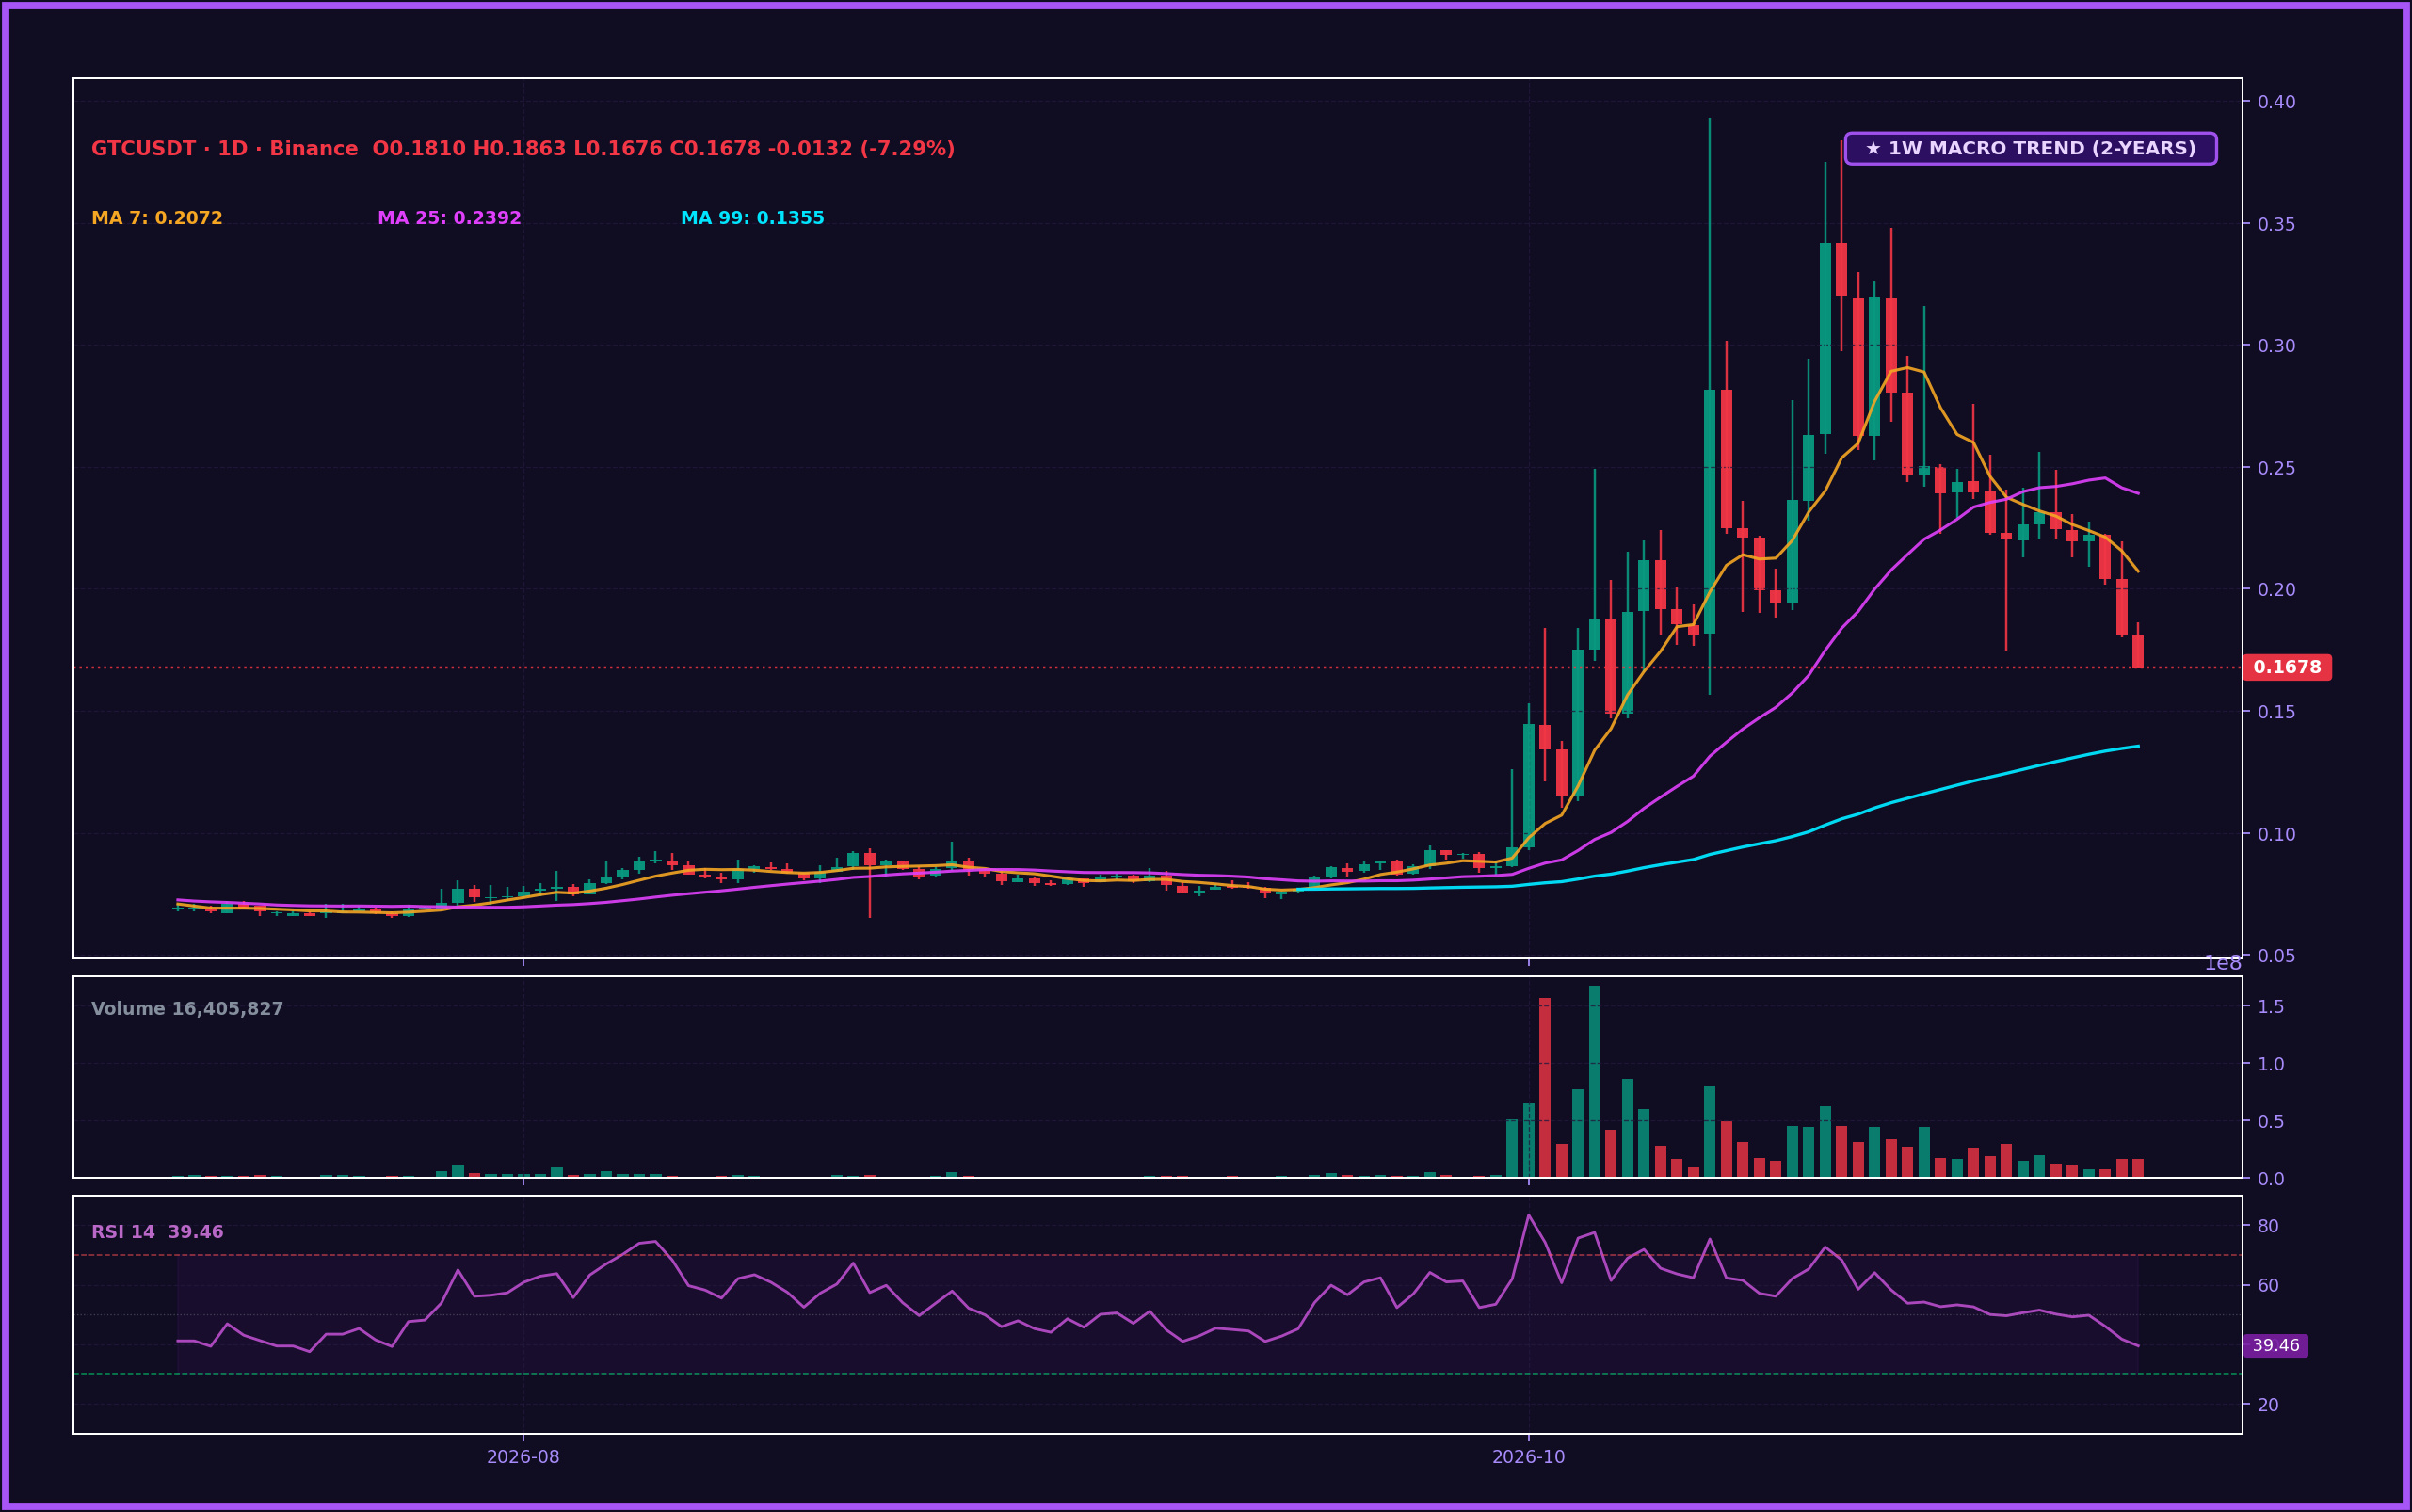
The macro picture on the 1D chart is as clear as day: a sea of red candles has taken over the market after the “magical” pump from the Upbit listing news back in October. Gitcoin may have plans to restructure and focus on technology with its Techne project set to launch in mid-December, but those announcements are just words in the wind now—not enough to get this “sliding board” going back up.
Meanwhile, the short sellers are laughing all the way to the bank.
Looking at the 1H chart, $GTC is limping along around $0.1678, and the RSI at 31.7 is scraping the bottom, showing that selling pressure is still brutal. The short-term moving averages, like MA7 ($0.1756) and MA25 ($0.1843), are like nooses dangling overhead, putting a damper on any potential upward momentum. The 24-hour volume of $5,312,318 USDT isn’t huge, but it’s enough to drag the price down by 20.86%.
The macro picture on the 1D chart is as clear as day: a sea of red candles has taken over the market after the “magical” pump from the Upbit listing news back in October. Gitcoin may have plans to restructure and focus on technology with its Techne project set to launch in mid-December, but those announcements are just words in the wind now—not enough to get this “sliding board” going back up.
Meanwhile, the short sellers are laughing all the way to the bank.