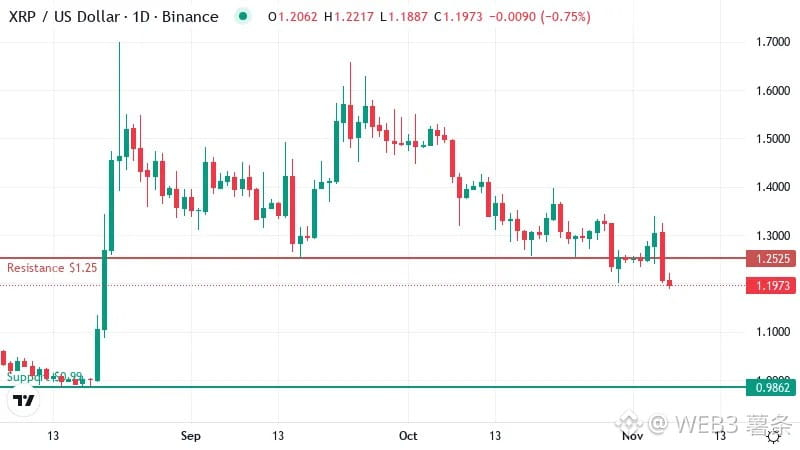
#xrp is still trading below the 50-day moving average (around $1.33) and the 200-day moving average, indicating that both short- and long-term trends are bearish. It has fallen nearly 20% over the past 30 days. Although the pace of selling has recently slowed, this does not yet indicate that the downtrend has ended.
Technical indicators show that the RSI is around 35. While it is approaching oversold territory, it has not yet entered it, meaning the price could still fall further. The MACD also continues to show bearish dominance, with buyers currently lacking any clear momentum to stage a rebound.
Key levels:
Resistance above: $1.25 and $1.31. A breakout above these levels would be needed to gradually reverse the weakness.
Support below: $0.99 is an important level to watch. If the price falls to this level and buying emerges, it could form a short-term bottom.
If $0.99 is decisively breached, XRP could face further downside risk.
Technical indicators show that the RSI is around 35. While it is approaching oversold territory, it has not yet entered it, meaning the price could still fall further. The MACD also continues to show bearish dominance, with buyers currently lacking any clear momentum to stage a rebound.
Key levels:
Resistance above: $1.25 and $1.31. A breakout above these levels would be needed to gradually reverse the weakness.
Support below: $0.99 is an important level to watch. If the price falls to this level and buying emerges, it could form a short-term bottom.
If $0.99 is decisively breached, XRP could face further downside risk.