BTC: Realized Profit-to-Loss Ratio
When realized losses exceed realized profits, market sentiment warrants extra caution.
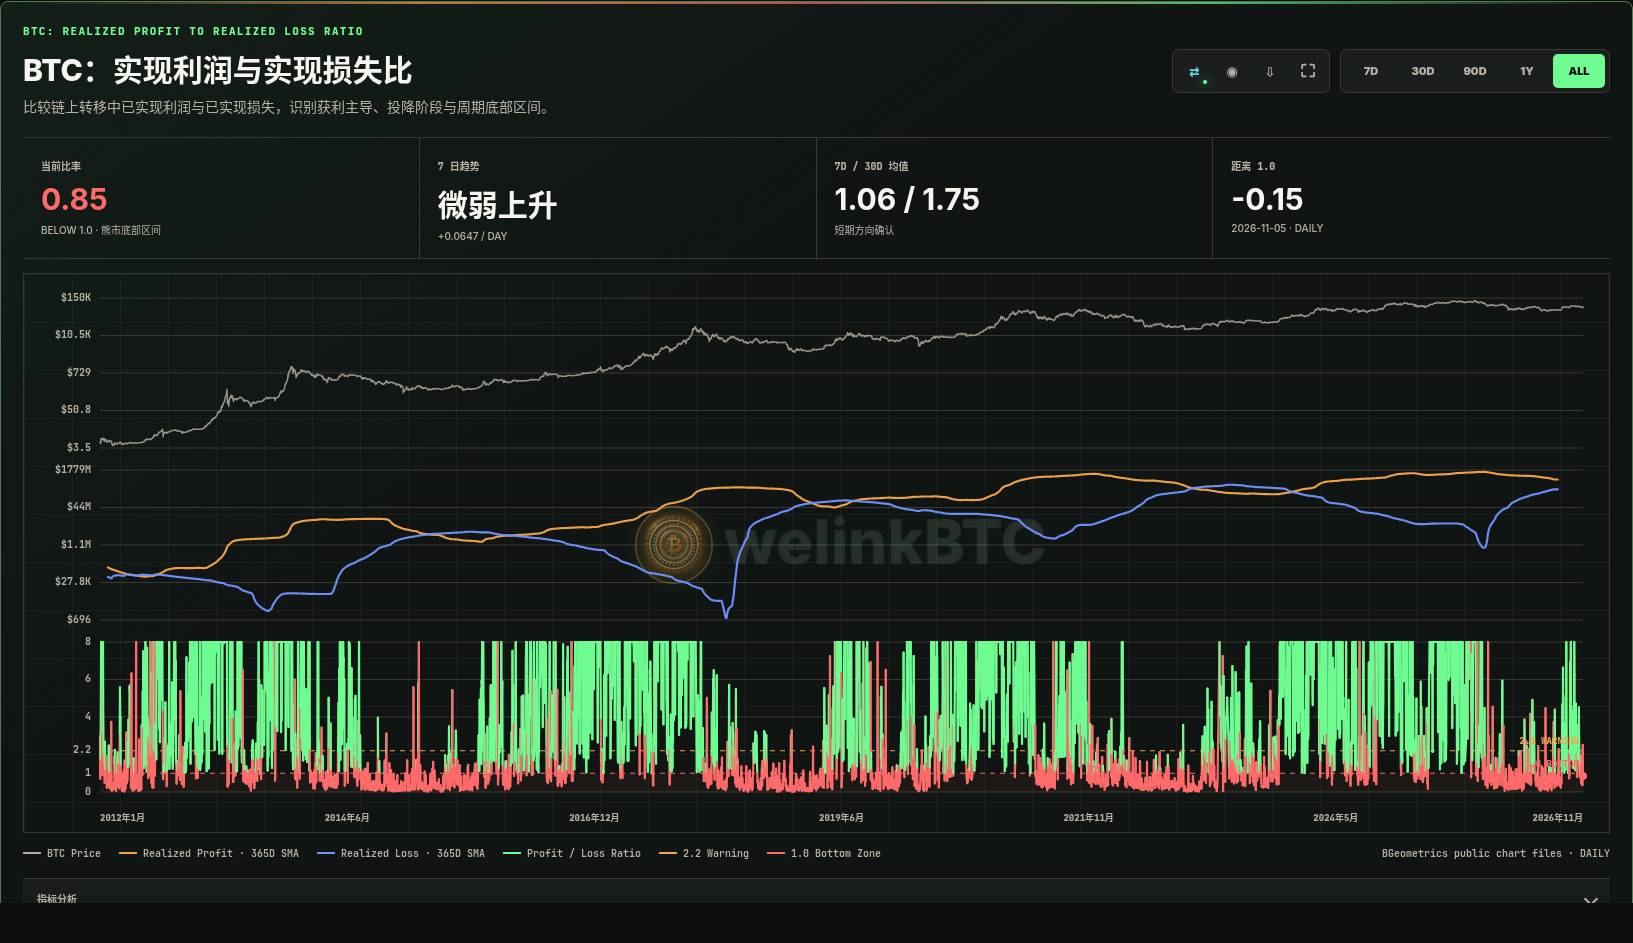
Based on daily data through 2026-11-05, BTC’s realized profit-to-loss ratio is 0.85, below the 1.0 break-even line. The page classifies it as being in the bear-market bottom watch zone. The 7-day and 30-day averages are 1.06 and 1.75, respectively, while the 30-day average fell below the 2.2 cycle-cooling watch line on 2026-11-03.
How should you read this indicator? It divides realized profits from on-chain transfers by realized losses. Above 1.0, profit-taking predominates; below 1.0, realized losses exceed realized profits, often corresponding to capitulation, a change of hands among holders, and periods of sentiment under pressure.
One important caveat: A drop below 1.0 indicates that selling is skewed toward realizing losses, putting the market in a watch zone. It does not mean a bottom has been confirmed, nor is it a standalone buy signal. To determine whether selling pressure is truly nearing its end, also consider spot demand, liquidity, short-term holder cost basis, and price structure.
More handpicked on-chain cycle indicators
Portal: https://welinkbtc-onchainmain.xyz/
Understand market cycles like a professional analyst
$BTC
When realized losses exceed realized profits, market sentiment warrants extra caution.
Based on daily data through 2026-11-05, BTC’s realized profit-to-loss ratio is 0.85, below the 1.0 break-even line. The page classifies it as being in the bear-market bottom watch zone. The 7-day and 30-day averages are 1.06 and 1.75, respectively, while the 30-day average fell below the 2.2 cycle-cooling watch line on 2026-11-03.
How should you read this indicator? It divides realized profits from on-chain transfers by realized losses. Above 1.0, profit-taking predominates; below 1.0, realized losses exceed realized profits, often corresponding to capitulation, a change of hands among holders, and periods of sentiment under pressure.
One important caveat: A drop below 1.0 indicates that selling is skewed toward realizing losses, putting the market in a watch zone. It does not mean a bottom has been confirmed, nor is it a standalone buy signal. To determine whether selling pressure is truly nearing its end, also consider spot demand, liquidity, short-term holder cost basis, and price structure.
More handpicked on-chain cycle indicators
Portal: https://welinkbtc-onchainmain.xyz/
Understand market cycles like a professional analyst
$BTC